- Waveforms produced by the heart's electrical current are recorded on ECG graphing paper.
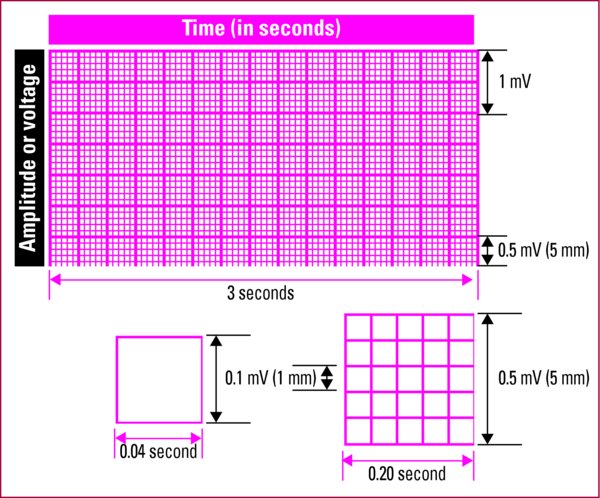
- The horizontal axis of the ECG strip represents time.
- Each small block equals 0.04 second.
- Five small blocks form a large block, which equals 0.2 second (0.04 second [one small block] multiplied by 5 [small blocks in a large block] = 0.2 second).
- Five large blocks equal 1 second (5 × 0.2).
- To measure or calculate heart rate (in beats/min), use a 6-second strip, which consists of 30 large blocks.
- The vertical axis of the ECG measures amplitude in millimeters (mm) or electrical voltage in millivolts (mV).
- Each small block represents 1 mm or 0.1 mV.
- Each large block represents 5 mm or 0.5 mV.
- To determine the amplitude of an ECG component (wave, segment, or interval), count the number of small blocks from the baseline to the highest (in a positive wave) or lowest (in a negative wave) point of the wave, segment, or interval on a standard 12-lead ECG.
ECG grid This ECG grid shows the horizontal and vertical axes and their respective measurement values.
|