Echocardiographic evaluation of the left ventricle (LV).
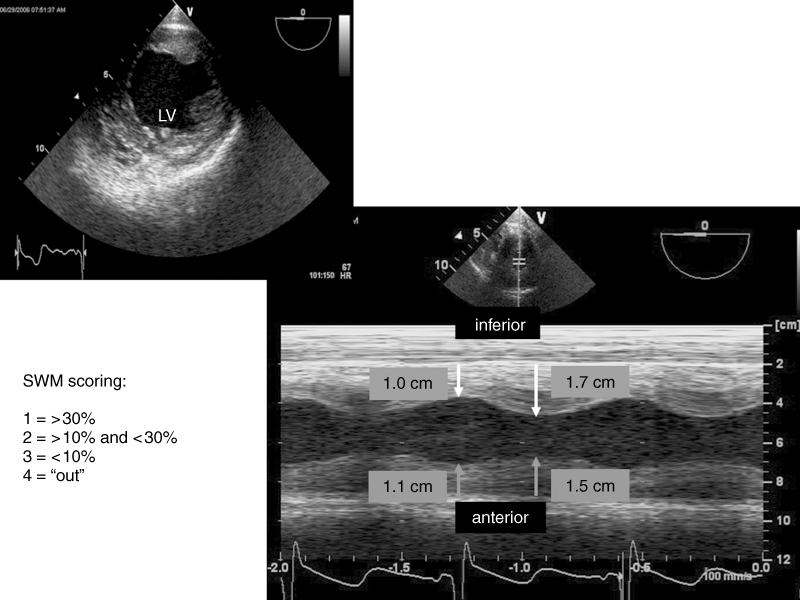
The transgastric midpapillary short-axis view of the LV is shown in left. By placing a cursor line across the middle of the inferior (top of the image) and anterior (bottom of the image) segments of the left ventricular myocardium, the motion of the segments over time is shown in the right image. The percentage of wall thickening can be either visually estimated or measured between diastole and systole. SWM, segmental wall motion.