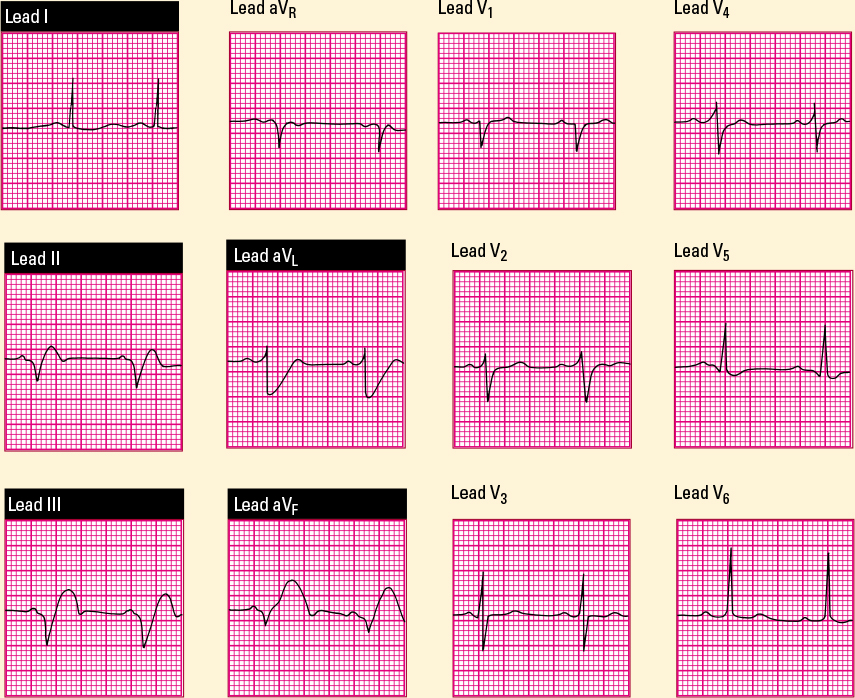
This 12-lead ECG shows the characteristic changes of an inferior wall MI. In leads II, III, and aVF, note the T-wave inversion, ST-segment elevation, and pathologic Q waves. In leads I and aVL, note the slight ST-segment depression, a reciprocal change. This ECG shows left axis deviation at −60 degrees. 
|