Screening
- History and physical examination with appropriate evaluation for risk factors and secondary causes. Medications associated with osteoporosis are summarized in Table 1. Investigations for secondary osteoporosis are summarized in Box 4.
- WHO guidelines for the diagnosis of osteoporosis are based on bone mineral density (BMD) measurements of the hip or spine in g/cm2 and are reported as a T score.
- Dual-energy x-ray absorptiometry (DEXA) is the gold standard for screening and monitoring changes in BMD due to excellent precision, widespread availability, low cost, and minimal radiation exposure.
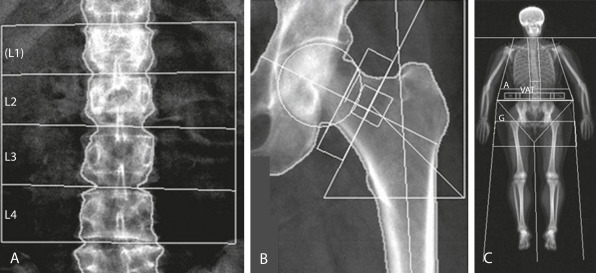
- DEXA (Fig. 1) is indicated in all women 65 yr and older and in postmenopausal women younger than 65 yr of age who are at risk for fracture (e.g., weight <127 lbs, parental history of hip fracture, use of medications that cause bone loss, current smoking, excessive alcohol use, rheumatoid arthritis, or presence of diseases that cause bone loss). Clinical indications for bone densitometry are summarized in Table 2. Causes of erroneous bone mineral density measures by DEXA in the lumbar spine are summarized in Table 3.
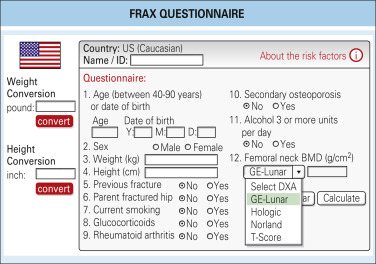
- FRAX questionnaire (Fig. 2): Use of FRAX calculator (www.sheffield.ac.uk/FRAX/) is proposed by the U.S. Preventive Services Task Force (USPSTF) to determine the need for screening in women between the ages of 50 and 64. If the FRAX 10-yr major osteoporotic risk is greater than or equal to 9.3%, the USPSTF recommends screening with DEXA scan.
- Currently, routine testing in men for osteoporosis is not recommended unless there are clinical manifestations of low bone mass.
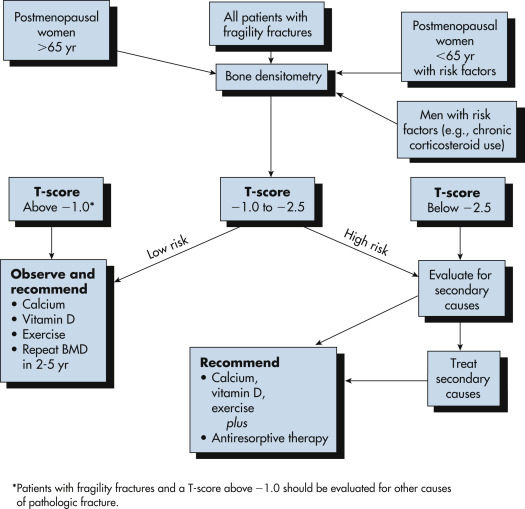
- Recommendations as to when to repeat bone density testing should be based on initial T scores (Fig. 3). Data from the Study of Osteoporotic Fractures indicates that in women with normal bone density or mild osteopenia, repeat testing might not be necessary for another 10 to 15 yr. For women with moderate osteopenia, a screening interval of 3 to 5 yr may be appropriate. For women with advanced bone loss/osteoporosis, testing every 1 to 2 yr is recommended.
Figure 3 Diagnosis and management of osteoporosis.

BOX 5 Recommended Laboratory Investigations for Individuals With Osteoporosis
Recommended screening in all patients
- Serum calcium, albumin, phosphorus ∗,†,‡,§
- Serum creatinine ∗,†,‡,§
- Liver function tests ∗
- Bicarbonate ∗
- Complete blood count ∗
- 24-hr urinary calcium level ∗,†,‡,§
- 25-hydroxyvitamin D level ∗,†,‡,§
- Thyroid-stimulating hormone level ∗,†,‡,§
Other testing, if appropriate
- Biochemical markers of bone turnover ∗,†,‡,§
- Cortisol levels ∗,‡
- Protein electrophoresis ∗,†,§
- Parathyroid hormone level ∗,§
|
From Hochberg MC: Rheumatology, ed 7, Philadelphia, 2019, Elsevier.
Figure 2 FRAX questionnaire.
From Hochberg MC: Rheumatology, ed 7, Philadelphia, 2019, Elsevier.
Figure 1 Dual-Energy x-Ray Absorptiometry (DEXA) Provides “areal” Bone Mineral Density (BMD) (g/cm2) and is Currently the Gold Standard for Diagnosis of Osteoporosis by Bone Densitometry (World Health Organization Definition T Score –25 or below) in (A) Posteroanterior Lumbar Spine (L1 through L4) or (B) Hip (Femoral Neck or Total). C, DEXA of the Whole Body Can Provide Information on Total and Regional BMD and Body Composition (Fat and Muscle Mass). Recent Additional Parameters Measured are Android A/Gynoid G Ratio and Visceral Adipose Tissue (VAT).
From Pope TL et al: Musculoskeletal imaging, ed 2, Philadelphia, 2014, Saunders.
TABLE 2 Clinical Indications for Bone Densitometry
| All postmenopausal women <65 yr who have one or more additional risk factors for osteoporosis (besides menopause) |
| All women >65 yr regardless of additional risk factors |
| To document reduced bone density in patients with vertebral abnormalities or osteopenia on radiographs |
| Estrogen-deficient women at risk for low bone density who are considering use of estrogen or an alternative therapy, if bone density would influence the decision |
| Women who have been receiving estrogen replacement therapy for prolonged periods or to monitor the efficacy of a therapeutic intervention or interventions for osteoporosis |
| To diagnose low bone mass in people treated with glucocorticoids |
| To document low bone density in people with asymptomatic primary or secondary hyperparathyroidism |
From Firestein GS et al: Firestein & Kelley’s textbook of rheumatology, ed 11, Philadelphia, 2021, Elsevier.
TABLE 3 Causes of Erroneous Bone Mineral Density Measures by DEXA in the Lumbar Spine
| Overestimation of Bone Mineral Density |
| Extraneous calcification (lymph nodes, aorta) |
| Degenerative disk and spine disease (osteophytes) |
| Ankylosing spondylitis |
| Vertebral fracture |
| Sclerotic metastases |
| Vertebral hemangioma |
| Overlying metal artifacts (navel rings) |
| Surgical interventions (metallic rods, spinal fusion) |
| Vertebroplasty |
| Paget disease |
| Treatment with strontium ranelate |
| Underestimation of Bone Mineral Density |
| Laminectomy |
DEXA, Dual-energy x-ray absorptiometry.
From Pope TL et al: Musculoskeletal imaging, ed 2, Philadelphia, 2014, Saunders.
TABLE 1 Medications Associated With Osteoporosis
| System | Medication |
|---|
| Endocrine | Aromatase inhibitors (e.g., anastrozole)
Excess thyroxine replacement
Glucocorticoids
Gonadotropin-releasing hormone agonists
Ovarian-suppressing drugs (e.g., medroxyprogesterone acetate)
Thiazolidinediones
SGLT2 inhibitors |
| Gastrointestinal | Proton pump inhibitors |
| Hematologic | Heparin
Warfarin |
| Infectious disease | Antiretroviral therapy |
| Immunosuppressant | Cyclosporine
Cytotoxic drugs
Tacrolimus |
| Neurologic | Anticonvulsants-phenytoin, phenobarbital, carbamazepine |
| Psychiatric | Selective serotonin reuptake inhibitors |
| Renal | Loop diuretics (e.g., furosemide) |
From Hochberg MC: Rheumatology, ed 7, Philadelphia, 2019, Elsevier.
BOX 4 Investigations for Secondary Osteoporosis in Older People With Low-Trauma Fractures or Low Bone Mineral Density
CBC ESR or CRP Biochemical profile: Including renal function, adjusted serum calcium, and alkaline phosphatase Thyroid function tests Serum testosterone, sex hormone-binding globulin, LH, FSH (men) Serum and urine electrophoresis (vertebral fractures) Serum 25OHD and PTH |
From Fillit HM: Brocklehurst’s textbook of geriatric medicine and gerontology, ed 8, Philadelphia, 2017, Elsevier.
Imaging Studies
- Bone mineral density (BMD) determination (see “Workup”) should be performed on all women with determined risk factors and/or associated secondary causes. Criteria for the diagnosis of osteoporosis based on measurement of bone density and T score are summarized in Table 4.
- Normal: BMD <1 SD below the young adult reference mean
- Osteopenia: BMD 1 to 2.5 SD below the young adult reference mean
- Osteoporosis: BMD >2.5 SD below the young adult reference mean
- For patients undergoing treatment: The frequency of BMD monitoring is controversial and many experts recommend that clinicians should not monitor BMD during the initial 5-yr drug treatment period because no studies have proven that such monitoring improves fracture outcomes.
- X-ray exam of appropriate part of skeleton (Figs. 4 and 5) is indicated to evaluate clinical osteoporotic fracture only.
Figure 4 Regional OsteoporosisHand Radiograph in Early Rheumatoid Arthritis (RA) Shows Periarticular Osteopenia at the Metacarpophalangeal and Interphalangeal Joints, with Joint Space Narrowing and Juxtaarticular Erosions. The Periarticular Osteopenia is the Earliest Radiographic Feature of RA and is Related to Hyperemia, Synovial Inflammation, and Local Cytokines that Stimulate Osteoclastic Bone Resorption.
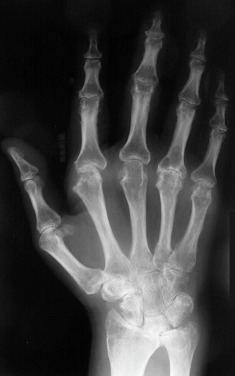
From Pope TL et al: Musculoskeletal imaging, ed 2, Philadelphia, 2015, Saunders.
Figure 5 General OsteoporosisRadiographic Features Include Reduced Radiographic Density (Osteopenia) with Reduction in the Number of Trabeculae, Which May Be Destroyed Completely, and the Bone Cortex Becomes Thinned as Evident in the Lateral Radiograph of the Calcaneus (A) and Radiograph of the Phalanx (B). When These Features are Present, Bone Densitometry Using Dual-Energy x-Ray Absorptiometry (DEXA) Should Be Suggested.
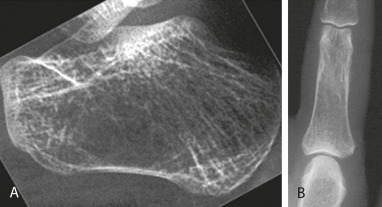
From Pope TL et al: Musculoskeletal imaging, ed 2, Philadelphia, 2015, Saunders.
TABLE 4 Diagnostic Categories for Osteoporosis Based on World Health Organization Criteria
| Category | Definition |
|---|
| Normal | BMD not more than 1 SD below the young adult mean value |
| Low bone mass (osteopenia) | BMD lying between 1 and 2.5 SD below the young adult mean value |
| Osteoporosis | BMD more than 2.5 SD below the young adult mean value |
BMD, Bone mineral density; SD, standard deviation.
From World Health Organization data, 1994. In Hochberg MC: Rheumatology, ed 7, Philadelphia, 2019, Elsevier.


