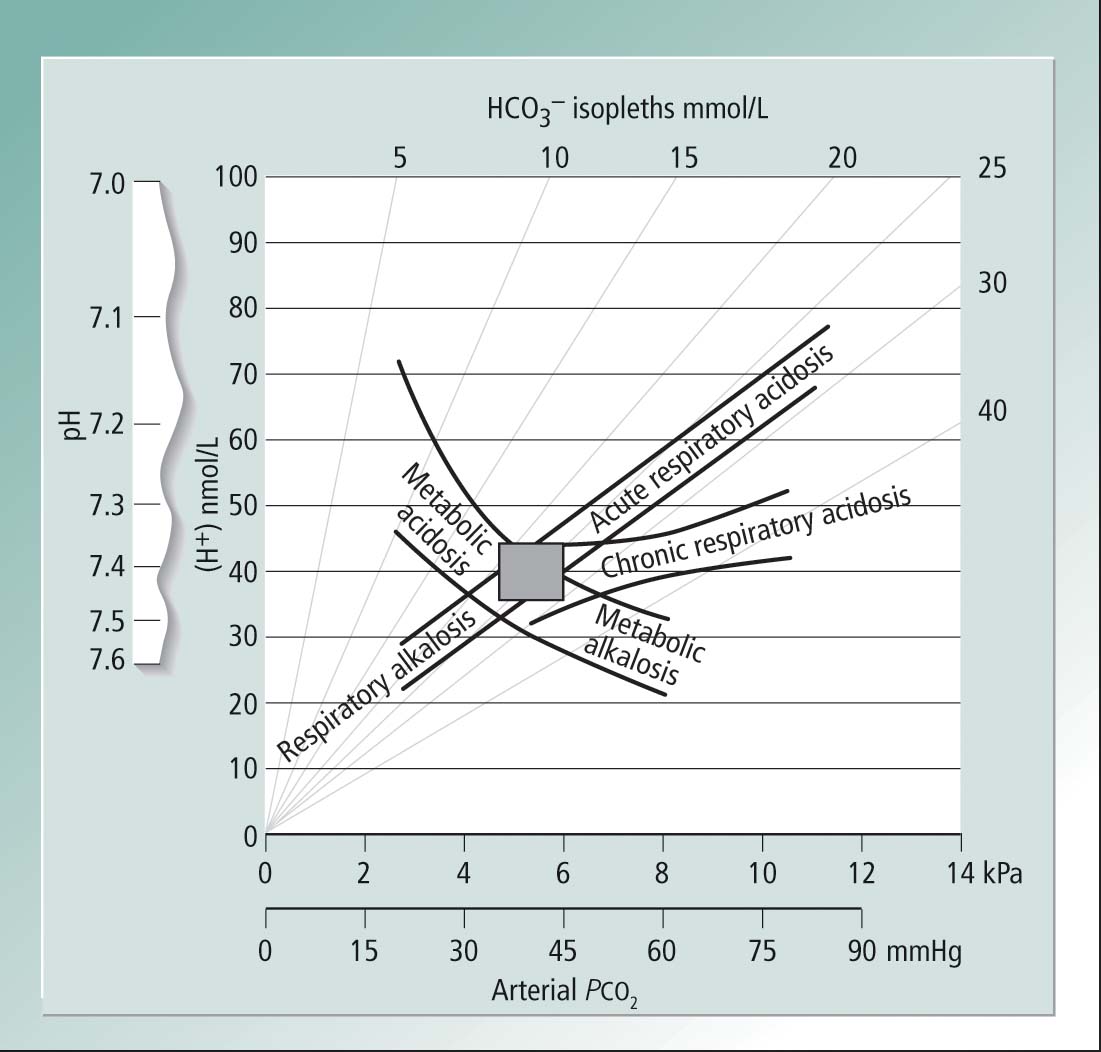
Acid-Base Diagram Relating Arterial pH or Hydrogen Ion Concentration to PaCO2

The shaded rectangle is the normal range. The 95% confidence limits of hydrogen ion concentration/PaCO2 relationships in single disturbances of acid-base balance are shown. Source: Flenley DC (1971) Lancet 1, 961. Reproduced with permission of Elsevier.