Three waveforms—A, B, and C—are used to monitor ICP.
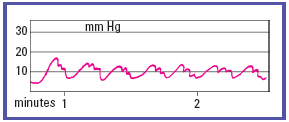
A normal ICP waveform (shown at right) typically shows a steep up ward systolic slope followed by a downward diastolic slope with a dicrotic notch. In most cases, this waveform occurs continuously and indicates an ICP between 0 and 15 mm Hg—normal pressure.

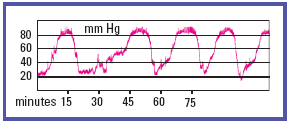
The most clinically significant ICP waveforms are A waves (shown at right), which may reach elevations of 50 to 100 mm Hg, persist for 5 to 20 minutes, then drop sharply—signaling exhaustion of the brain's compliance mechanisms. Certain activities, such as sustained coughing or straining during defecation, can cause temporary elevations in thoracic pressure.

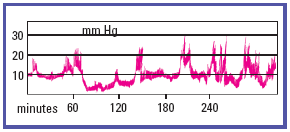
B waves, which appear sharp and rhythmic with a sawtooth pattern, occur every 1½ to 2 minutes and may reach elevations of 50 mm Hg. The clinical significance of B waves isn't clear, but the waves correlate with respiratory changes and may occur more often with decreasing compensation.

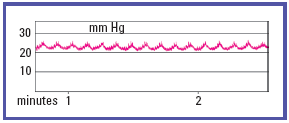
Like B waves, C waves are rapid and rhythmic, but they aren't as sharp. Clinically insignificant, they may fluctuate with respirations or systemic blood pressure changes.

