According to CDC: BMI is used as a screening tool to identify possible weight problems for children. CDC and the American Academy of Pediatrics (AAP) recommend the use of BMI to screen for overweight and obesity in children beginning at 2 years old.
For children, BMI is used to screen for obesity, overweight, healthy weight, or underweight. However, BMI is not a diagnostic tool. For example, a child may have a high BMI for age and gender, but to determine whether excess fat is a problem, a health-care provider would need to perform further assessments. These assessments might include skinfold thickness measurements, evaluations of diet, physical activity, family history, and other appropriate health screenings.
First, BMI is calculated according to instructions below, then, BMI must be compared with age- and gender-specific data on the following percentile based charts.
First, calculate BMI using one of the following formulas:
| Measurement Units | Formula and Calculation |
|---|---|
| Kilograms and meters (or centimeters) | Formula: weight (kg)/[height (m)]2 With the metric system, the formula for BMI is weight in kilograms divided by height in meters squared. Because height is commonly measured in centimeters, an alternate calculation formula, dividing the weight in kilograms by the height in centimeters squared, and then multiplying the result by 10,000, can be used. |
| Pounds and inches | Formula: weight (lb)/[height (in)]2 × 703 When using English measurements, ounces (oz) and fractions must be changed to decimal values. Then, calculate BMI by dividing weight in pounds (lb) by height in inches (in) squared and multiplying by a conversion factor of 703 |
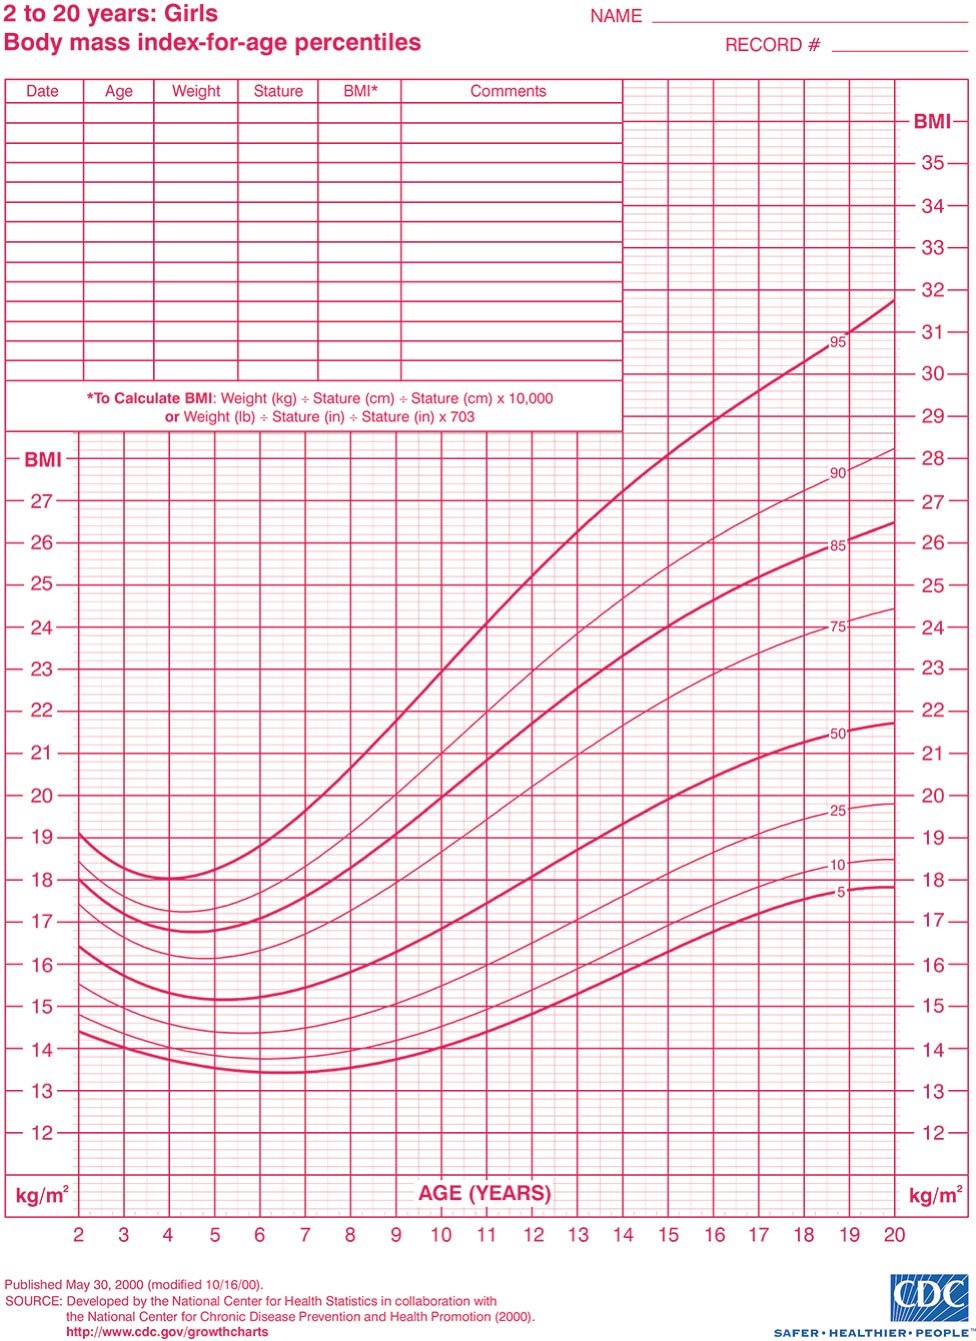
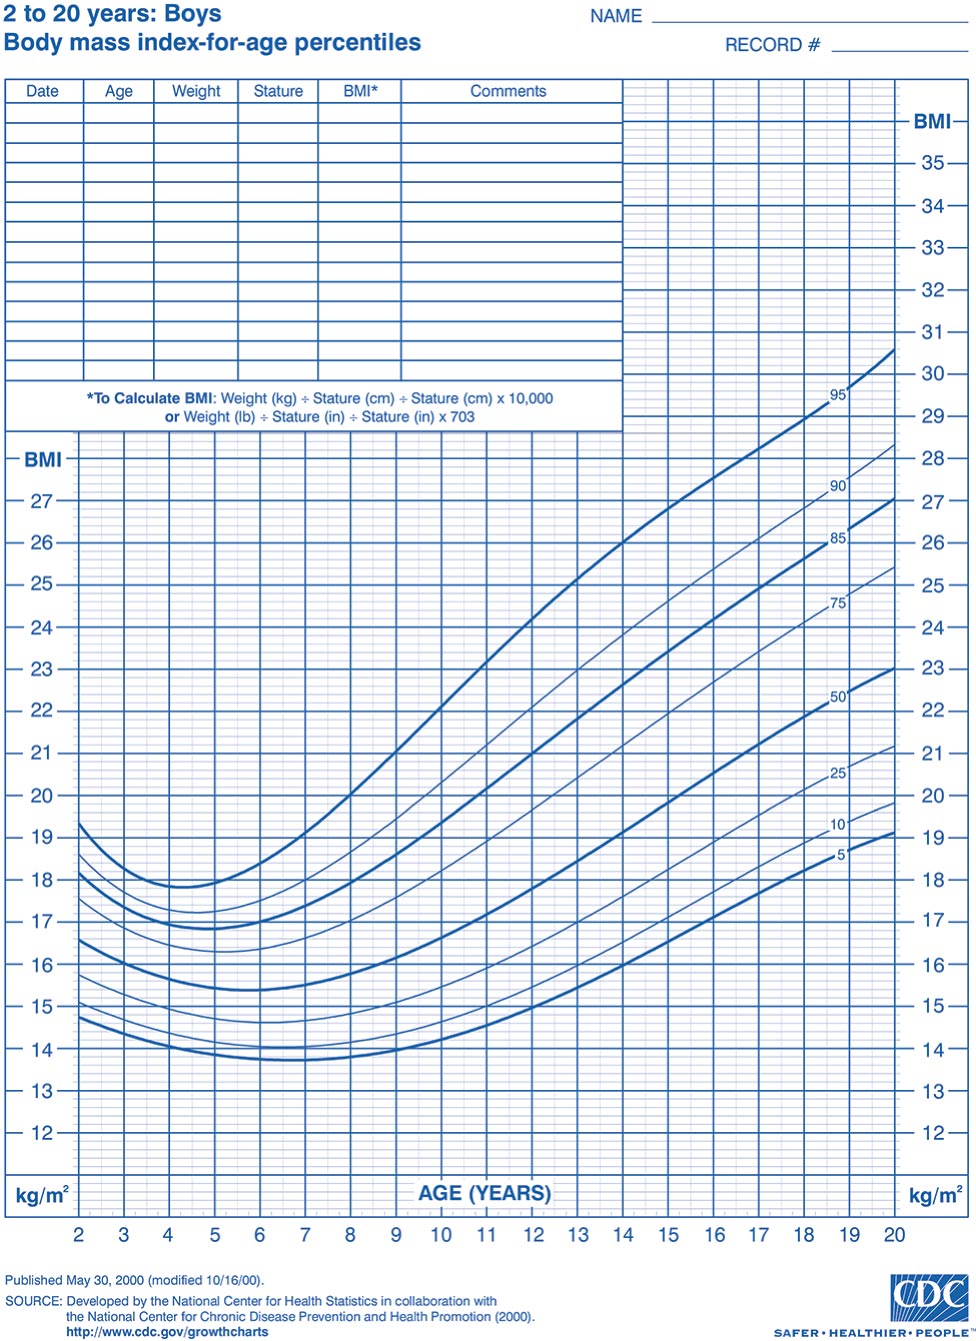
Next, to determine BMI percentile, plot the child’s BMI on the appropriate percentile chart (see following BMI percentile charts).
- Alternative method for calculating BMI and BMI-for-age percentile: use BMI calculator at the following Web site: http://nccd.cdc.gov/dnpabmi/Calculator.aspx
Last, plot the child’s BMI on the following boy’s or girl’s BMI chart
Published May 30, 2000 (modified 10/16/00). Source: Developed by the National Center for Health Statistics in collaboration with the National Center for Chronic Disease Prevention and Health Promotion (2000). http://www.cdc.gov/growthcharts. Retrieved from http://www.cdc.gov/growthcharts/clinical_charts.htm.

CDC interpretation of BMI percentile
| Weight Status Category | Percentile Range |
|---|---|
| Underweight | Less than the 5th percentile |
| Healthy weight | 5th percentile to less than the 85th percentile |
| Overweight | 85th percentile to less than the 95th percentile for children and teens of same age and gender |
| Obese | Equal to or greater than the 95th percentile for children and teens of same age and gender |
Data from http://www.cdc.gov/healthyweight/assessing/bmi/childrens_bmi/about_childrens_bmi.html.
