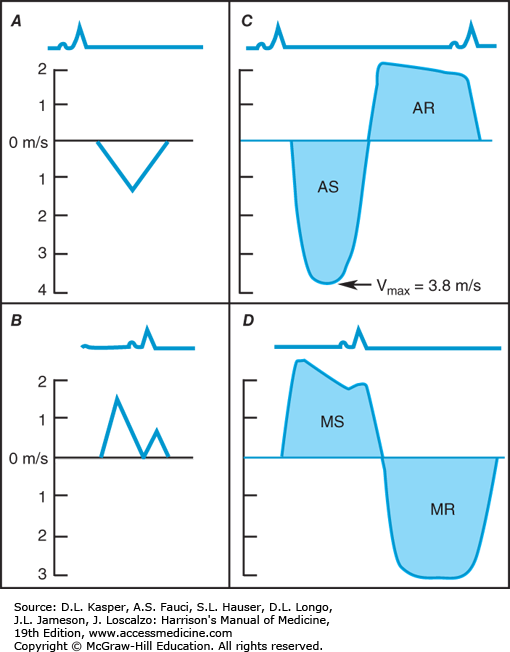
Schematic Presentation of Normal Doppler Flow Across the Aortic (A) and Mitral (B) Valves

Schematic presentation of normal Doppler flow across the aortic (A) and mitral (B) valves. Abnormal continuous wave Doppler profiles: C. Aortic stenosis (AS) [peak transaortic gradient = 4 × Vmax2 = 4 ×(3.8)2 = 58 mmHg] and regurgitation (AR). D. Mitral stenosis (MS) and regurgitation (MR).