Graphical Representation of the Pressure

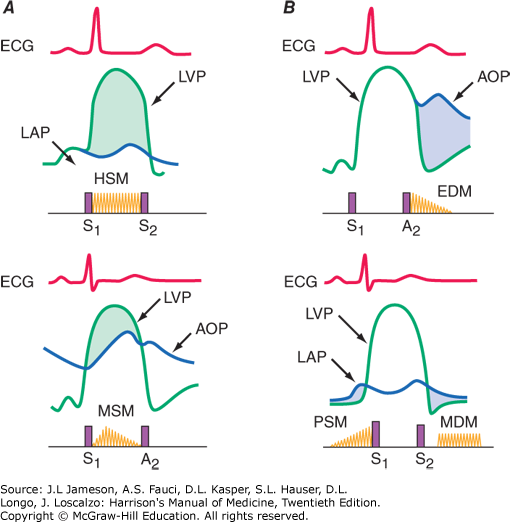
A. Top. Graphic representation of the systolic pressure difference (green shaded area) between left ventricle and left atrium with phonocardiographic recording of a holosystolic murmur (HSM) indicative of mitral regurgitation. ECG, electrocardiogram; LAP, left atrial pressure; LVP, left ventricular pressure; S1, first heart sound; S2, second heart sound. Bottom. Graphic representation of the systolic pressure gradient (green shaded area) between left ventricle and aorta in pt with aortic stenosis. A midsystolic murmur (MSM) with a crescendo-decrescendo configuration is recorded. AOP, aortic pressure. B. Top. Graphic representation of the diastolic pressure difference between the aorta and left ventricle (blue shaded area) in a pt with aortic regurgitation, resulting in a decrescendo, early diastolic murmur (EDM) beginning with A2. Bottom. Graphic representation of the diastolic left atrial-left ventricular gradient (blue areas) in a pt with mitral stenosis with a mid-diastolic murmur (MDM) and late presystolic murmurs (PSM).