section name header

Objectives

Is Your Study Good, Bad, or Ugly?

By the end of the chapter, students will be able to:

Key Terms

Feasibility

Before selecting any type of research instrument, you should always assess how feasible or practical the tool is. For example, if you want to use computer-assisted interviewing techniques to survey adolescents about sexual behavior, but your grant is for $1000 and each device costs $1200, it is probably not a practical plan. A study that involves asking patients with dementia to complete a 24-hour recall of food consumption also lacks feasibility. In these cases, the researcher needs to take a moment for a quick reality check! Being a wise nurse, you know that you should always first consider the feasibility or practical aspects of the study’s measurement tool, such as the cost, time, training, and limitations of the study sample (physical, cultural, educational, psychosocial, etc.). Only then should you begin the analysis of the validity and reliability of the instruments themselves.

Validity

After you determine that your instrument is feasible for use in your study, you can then assess the validity and reliability of your tool. The information you gather is helpful only if your measurement and collection methods are accurate, or valid. You can ensure that an instrument has validity in several ways:

These steps are all part of ensuring content validity.

You can also show validity in your survey by comparing your results with those of a previously validated survey that measures the same thing. This type of comparison is called convergent validity. For example, if you find a correlation of 0.4 or higher, that finding strengthens the validity of both instruments, yours and the previous one (Grove, 2007). In turn, if your survey is later found to be able to predict the length of stay for those admitted in the future, that finding will strengthen the validity of your instrument, and your study will have predictive validity as well.

Some instruments are considered valid because they measure the opposite variable of a previously validated measurement and find the opposite result. For instance, suppose a group of people with elevated serum cholesterol levels also scored low on a survey you designed to measure intake of fruits and vegetables. This result is an example of divergent validity for your instrument. The group with high cholesterol also had a poor diet. If the negative correlation is greater than or equal to -0.4, the divergent validity of both measures is strengthened (Grove, 2007).

Another way to show validity with opposite results is if your instrument detects a difference in groups already known to have a difference. This is also referred to as construct validity testing using known groups. For example, you are testing a new instrument to examine labor outcomes in women who have already had a baby versus those experiencing their first labor. The instrument measures the perceived length of labor. Length of labor has already been shown to be shorter for women who have had a baby. You find that those who have had a baby have a perceived length of labor that is on average 2 hours shorter than those who have not had a baby. This finding supports the validity of your new measurement tool because it detected a difference that was known to exist.

Reliability

Reliability means that your measurement tool is consistent or repeatable. When you measure your variable of interest, do you get the same results every time? Reliability is different from accuracy or validity. Suppose, for example, that you measure the weight of the study participants, but your scale is not calibrated correctly: it is off by 20 pounds. When your 170-pound participant gets on the scale, it shows she is 190 pounds. She steps off and back on three times, and each time it indicates 190 pounds. You get the same measurement every time she steps on the scale; thus, the measurement is repeatable and reliable. However, in this case, it is not accurate or valid, not to mention that all of your subjects will drop out of your study because they dread getting on your scale! The bottom line is that a measure can be reliable and not valid, but it can’t be valid and not reliable. Think of it this way: for an instrument to be accurate (valid), it must be accurate and reliable.

Three main factors relate to reliability: stability, homogeneity, and equivalence. Stability is the consistent or enduring quality of the measure. A stable measure:

You need to evaluate the stability of your measurement instrument at the beginning of the study and throughout it. For example, if your thermometer breaks, the instrument that was once stable is no longer available. As a result, your ongoing results are no longer reliable, and you need to have a protocol to figure out quickly how to reestablish stability.

The second quality of a reliable measure, homogeneity, is the extent to which items on a multi-item instrument are consistent with one another. For example, your survey may ask several questions designed to measure the level of family support. The questions may be repeated but worded differently to see whether the individuals completing the survey respond in the same way. For example, one question may ask, “What level of family support do you feel on most days?” and the choices may be high, medium, and low. Later in the survey, you may ask the individual to indicate on a scale of 1 to 10 the degree of family support felt on an average day. If the instrument has homogeneity, those who answered that they had a medium level of family support on most days should also be somewhere around the middle of the 1-10 scale. If so, then your instrument is said to have internal consistency reliability.

Internal consistency reliability is useful for instruments that measure a single concept, such as family support, and is frequently assessed using Cronbach’s alpha. Cronbach’s alpha ranges from 0 (no reliability in the instrument scale) to 1 (perfect reliability in the instrument scale), so a higher value indicates better internal consistency reliability. You may hear more about this test in future statistics or research classes, but right now, you just need to know that it can be used to establish homogeneity or internal consistency reliability (Nieswiadomy, 2008).

The third factor relating to reliability is equivalence. Equivalence is how well multiple forms of an instrument or multiple users of an instrument produce/obtain the same results. Measurement variation reflects more than the reliability of the tool itself; it may also reflect the variability of different forms of the tool or variability due to various researchers administering the same tool. For example, if you want to observe the color of scrubs worn by 60 nurses at lunchtime on a particular day, you might need help in gathering that much data in such a short period of time. You might ask two research assistants to observe the nurses. When you have more than one individual collecting data, you should determine the inter-rater reliability. One way to do this is to have all three individuals collecting data observe the first five nurses together and then classify the data individually. For example:

In this example, the inter-rater reliability between you and the third data collector is 100%, whereas it is 0% between you and the second collector. You have clearly identified a problem with the instrument’s inter-rater reliability.

One way to increase reliability is to create color categories for data collection, such as blue, green, orange, yellow, and other. In this case:

Clearly, you have improved the inter-rater reliability, but some variability is left because of the collectors’ differences in interpretation of colors. With this information, you may decide that the help of the second data collector isn’t worth the loss in inter-rater reliability. You might run the study with only two data collectors, or you may decide to sit down, define specific colors with the second data collector, and then reexamine the inter-rater reliability. You must consider this concern whenever the study requires more than one data collector in all such cases.

The readability of an instrument can also affect both the validity and reliability of the tool. If your study participants cannot understand the words in your survey tool, there is a very good chance they will not complete it accurately or consistently, which would ruin all your hard work. Good researchers assess the readability of their instrument before or during the pilot stages of a study.

One last point to remember is that the validity and reliability of an instrument are not inherent attributes of the instrument but are characteristics of the use of the tool with a particular group of respondents at a specific time. For example, a tool that has been shown to be valid and reliable when used with an urban elderly population may not be valid and reliable when used with a rural adolescent population. For this reason, the validity and reliability of an instrument should be reassessed whenever that instrument is used in a new situation.
Screening Tests

Different but related terms are utilized when a screening test is selected. The accuracy of a screening test is determined by its ability to identify subjects who have the disease and subjects who do not. However, accuracy does not mean that all subjects with a positive screen have the disease and that all subjects with a negative screen do not.

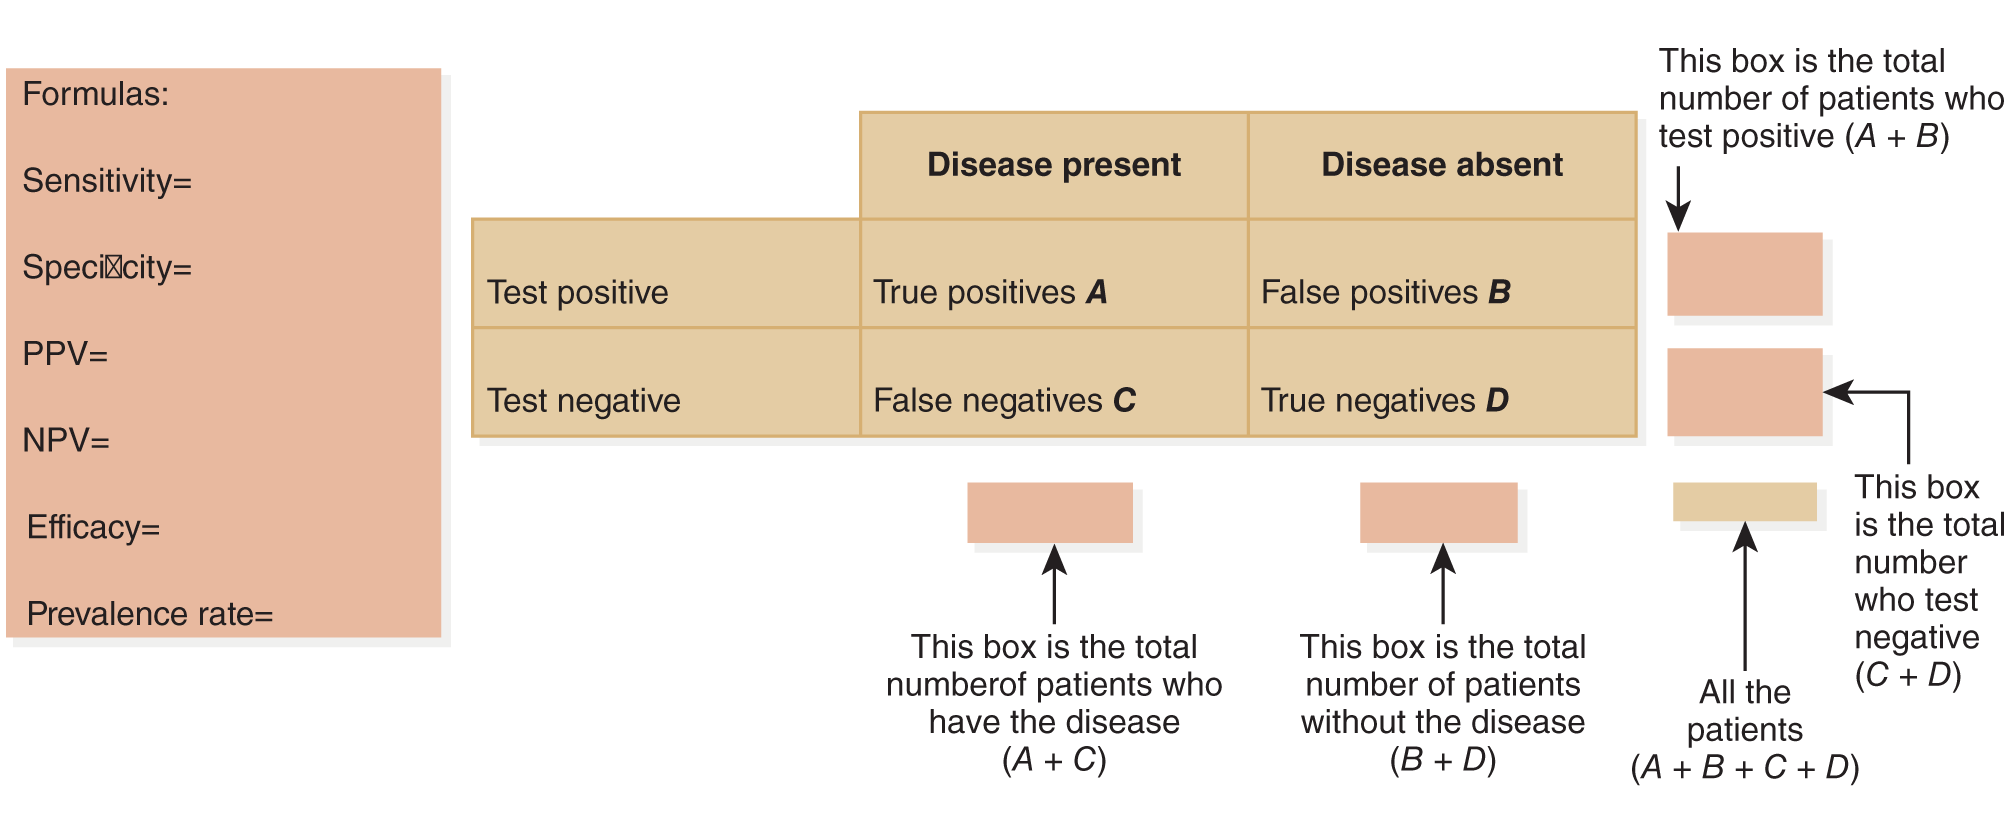
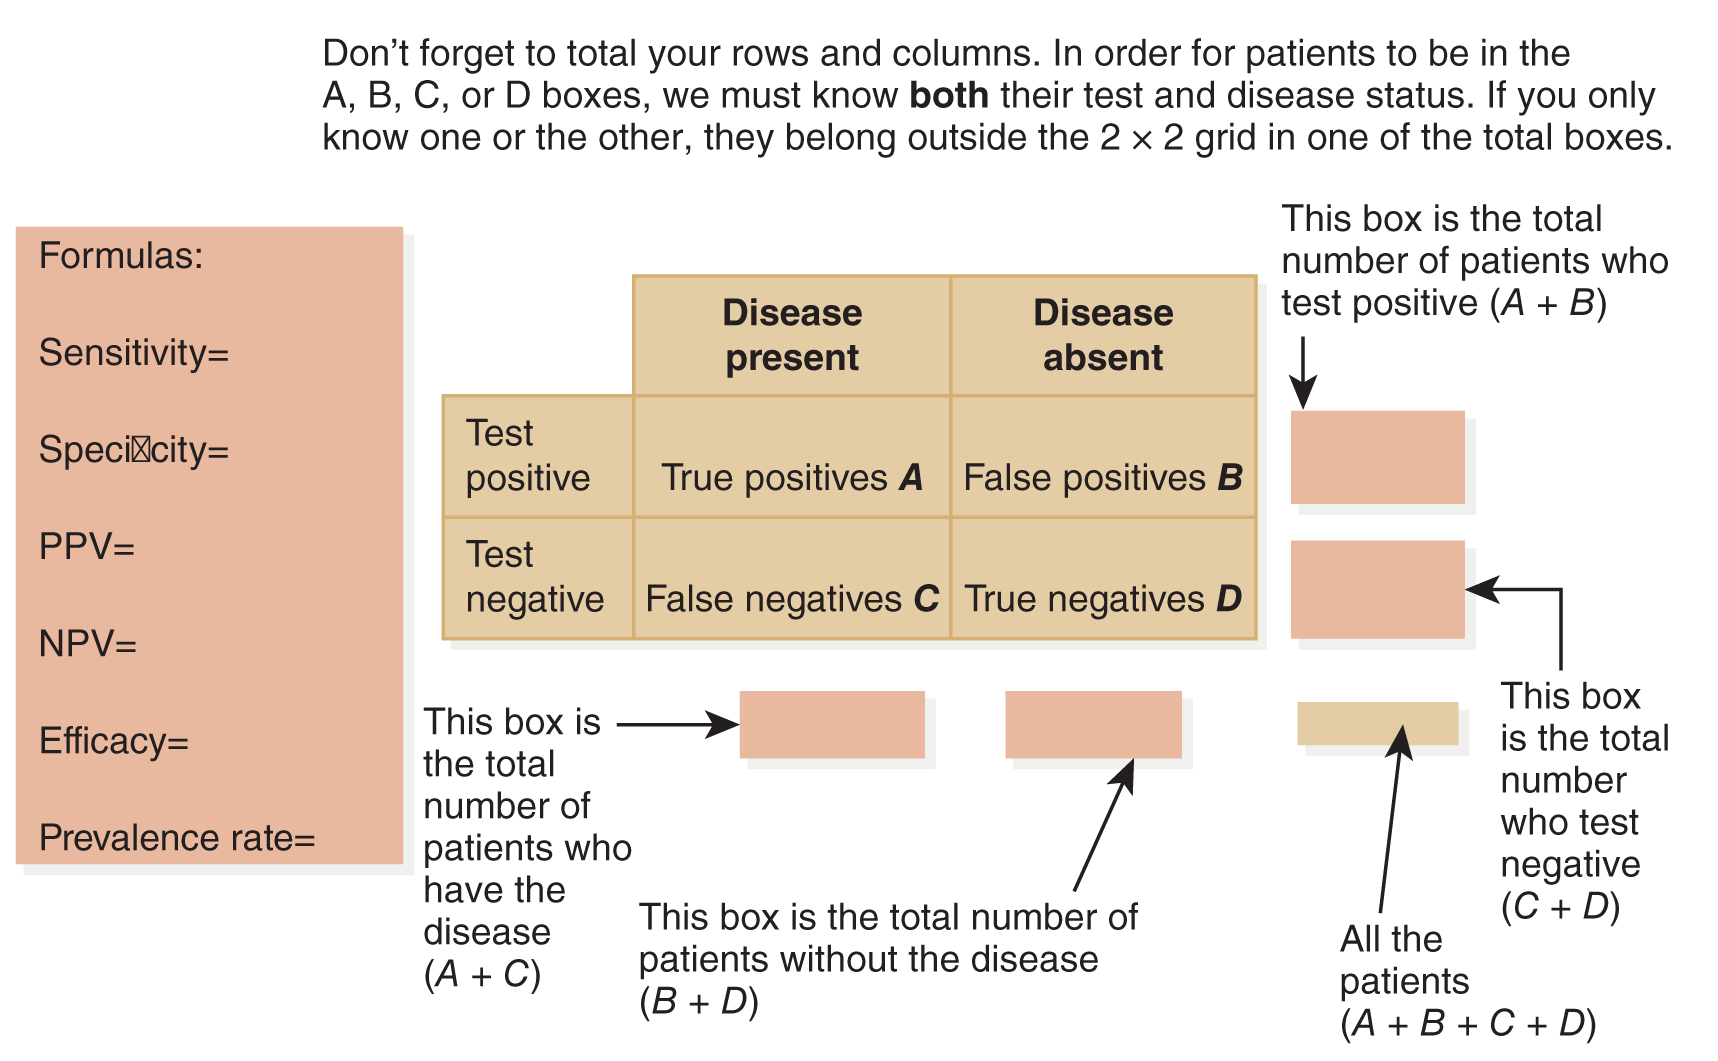
The four possible outcomes from any screening test are best illustrated in a standard 2 × 2 table, also called a contingency table (see Figure 4-1).

Figure 4-1: A 2 x 2 Table.

images/9781284254990_CH04_FIGF01.png

Don’t forget to total your rows and columns. For patients to be in the A, B, C, or D boxes, we must know both their test and disease status. If you know only one or the other for a patient, that patient belongs outside the 2 × 2 grid in one of the total boxes.

Sensitivity

When evaluating a screening test, one of the things nurses like to know is the probability that a patient will test positive for the disease if the patient has the disease. This is known as the sensitivity of the test and can be calculated by the equation in Figure 4-2. This equation should make sense. Take the number of subjects who are sick and test positive (true positives), and divide this number by the total number of subjects who are ill. It is a matter of percentages: the number of patients who are really sick and who test positive divided by the total number of people who really are sick. If a screen is sensitive, it is very good at identifying people who are actually sick, and it has a low percentage of false negatives. Sensitivity is particularly important when a disease is fatal or contagious or when early treatment helps.

Figure 4-2: Formula to Calculate the Sensitivity of a Screen.

images/9781284254990_CH04_FIGF02.png

Specificity

Another piece of information that helps evaluate a screening tool is the specificity, or the probability that a well subject will have a negative screen (no disease). Using the same 2 × 2 table, specificity can be calculated with the equation in Figure 4-3. Similar to the previous equation, this equation takes the number of people who are not ill and who have a negative screening test (true negatives) and divides this number by the total number of not-ill people. When a screen is highly specific, it is very good at identifying subjects who are not ill, and it has a low percentage of false positives. Specificity is particularly important if you have transient subjects and it would be difficult to find them again in the future.

Figure 4-3: Formula to Calculate the Specificity of a Screen.

images/9781284254990_CH04_FIGF03.png

Sensitivity and specificity tend to work in a converse balance with each other. Often, a loss in one is traded for an improvement in another. For example, suppose you are a nurse working on an infectious disease outbreak in a mobile military unit overseas. Your ability to find these patients again is very limited, so you want to be as sure as possible that those who screen negative and who leave the mobile facility are not carrying the disease for which you are screening. Thus, you select a highly specific test that is very good at identifying those who do not have the disease for which you are screening. When a highly specific test is negative, you know the chances are very good that the person is healthy and can leave the facility without a concern that they could spread the disease for which you are screening. You can then hold or contain those who do test positive for further testing and evaluation.

From the Statistician

Brendan Heavey

Sensitivity and Specificity

Let’s review some concepts in this chapter in the context of testing a large group of individuals for tuberculosis. For instance, when you entered nursing school, you were probably subjected to tests to determine whether you were ever infected with tuberculosis. The first step in the testing process is a purified protein derivative (PPD), which shows whether a person has antibodies to the bacterium that causes tuberculosis. A person with a positive response to this test may be asked to undergo any number of tests, including:

  • Serological testing
  • Chest x-ray
  • Biopsy
  • Urine culture
  • Cerebrospinal fluid sample
  • Computed tomography (CT) scan
  • Magnetic resonance imaging (MRI) scan

Each of these tests has a number of different characteristics. They can all be used in the diagnosis of tuberculosis, but which test is best?

This question turns out to be very challenging, and the answer depends on the definition of “best.” In addition, each person’s definition of best can be different and can change depending on that individual’s perception of reality. For instance, each test costs a different amount to administer, so is the cheapest test the best? (If you thought you had tuberculosis, cost would probably not be your criterion for best.) Each test also ranges in its degree of invasiveness. Would you want to be subjected to a cerebrospinal fluid sample (which is very painful) if you didn’t think you had the disease and just wanted to get into nursing school?

Each of these tests has a different sensitivity and specificity. A very important trait of each test that you should be interested in knowing is how often a person with tuberculosis is actually diagnosed correctly. A second trait of interest is how often a person without tuberculosis is correctly diagnosed. In general, a high-sensitivity/lower-specificity test is administered first to determine a large set of people who may have the disease. Sensitive tests are very good at identifying those who have a disease. Then additional costs and tests are incurred to increase specificity, or eliminate people who are actually healthy (and were false positives), before diagnosis and treatment begin.

This approach is like using a microscope. The first step is to use a low-resolution lens to find the area of a slide that you are interested in. Then you increase the resolution to look more closely at the object of interest. A test with high sensitivity/low specificity is like a low-resolution lens to identify those who may have the disease. As you increase specificity, you narrow down the population of interest and eliminate those who were falsely testing positive. An example of this practice is included in Doering et al. (2007).

Positive Predictive Value of a Screen

Another important concept to understand about any screening test is the positive predictive value (PPV). The PPV tells you the probability that a subject actually has the disease given a positive test result—that is, the probability of a true positive. Look back at the 2 × 2 table in Figure 4-1. You can calculate the PPV with the equation in Figure 4-4.

Figure 4-4: Formula to Calculate the Positive Predictive Value of a Screen.

images/9781284254990_CH04_FIGF04.png

Many students find this concept confusing. It depends not just on the sensitivity and specificity of the test and the prevalence of the illness in the population being screened. Prevalence is the amount of disease (the number of cases) present in the population divided by the total population. If you look back at the 2 × 2 table, you can determine the prevalence quite easily. It is just the number of people who have the disease divided by the total population. To express prevalence as a rate/percentage, just multiply the prevalence by 100 (see Figure 4-5).

Figure 4-5: Formula to Calculate Prevalence From a 2 × 2 Table.

images/9781284254990_CH04_FIGF05.png

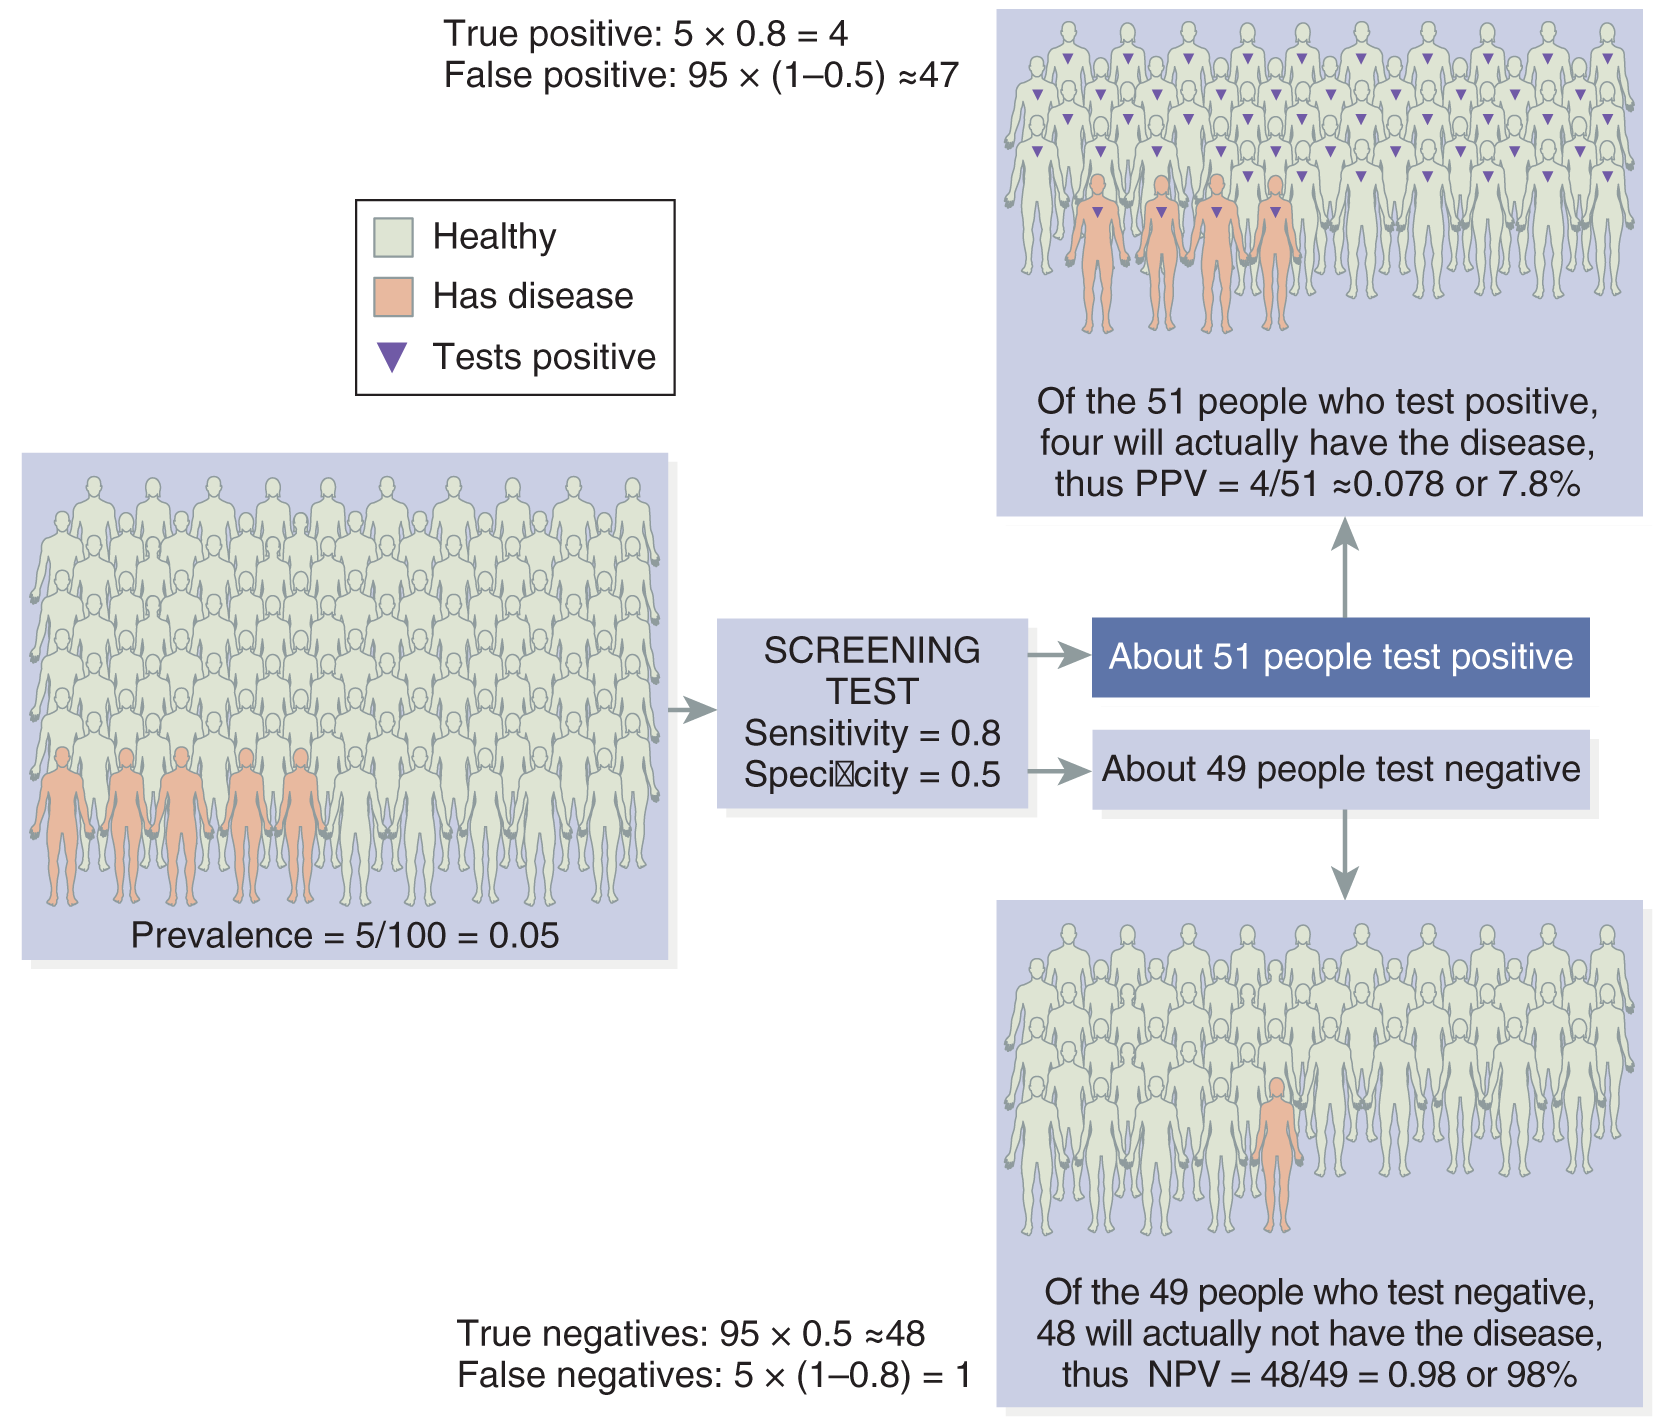
Suppose you administer a screening test with an established sensitivity and specificity in a population with a low prevalence of the disease. In that case, your screening test will have a low positive predictive value. Let’s look at an example. If you apply a screen with a sensitivity of 80% and a specificity of 50% to a population with a prevalence rate of 5%, your PPV will be only 7.8% (see Figure 4-6).

Figure 4-6: Application of Screen in a Sample with a 5% Prevalence Rate.

images/9781284254990_CH04_FIGF06.png

Data from Genomes Unzipped. (2010). How well can a screening test predict disease risk? http://genomesunzipped.org/2010/08/predictive-capacity-of-screening-tests.php

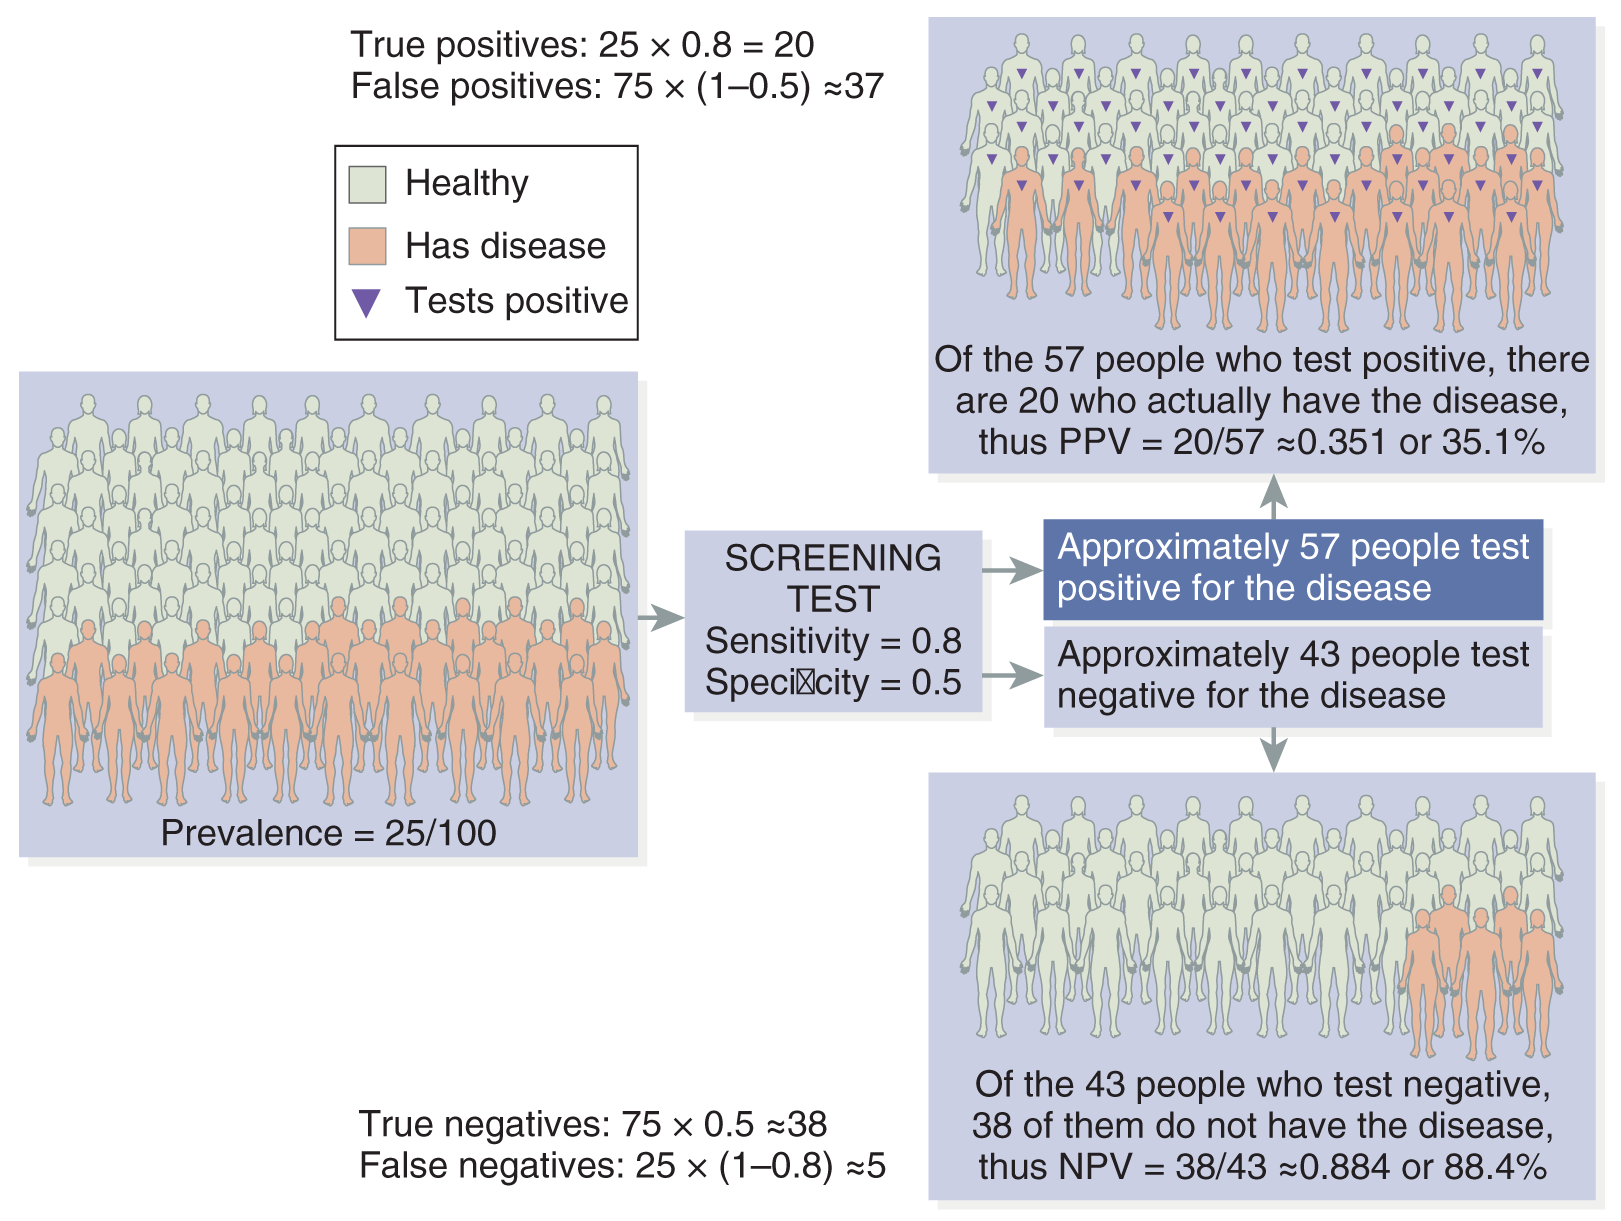
However, suppose you administer the same test with the same sensitivity and specificity, where 25% of the population has the condition. In that case, your screening will have a heightened positive predictive value of 35.1%. Even without looking at the 2 × 2 table, this phenomenon makes sense. If you are looking for a very rare disease, a positive test result in that population is more likely to be a false positive than in a population where 25% of the population has the disease. When prevalence increases, PPV increases, and vice versa (Figure 4-7). The two measures travel together in the same direction.

Figure 4-7: Application of Screen in a Sample with a 25% Prevalence Rate.

images/9781284254990_CH04_FIGF07.png

Data from Genomes Unzipped. (2010). How well can a screening test predict disease risk? http://genomesunzipped.org/2010/08/predictive-capacity-of-screening-tests.php

Negative Predictive Value

A related concept is the negative predictive value (NPV) of a test: if your subject screens negatively, the NPV tells you the probability that the patient really does not have the disease. Like the PPV, this measure depends on sensitivity, specificity, and the prevalence of the illness in the population. Using the 2 × 2 table again, you can determine the NPV using the equation in Figure 4-8. With our previous example, you will see that when the prevalence of the disease is 5%, the NPV is 98% (see Figure 4-6), but when the prevalence is higher, and 25% of the sample has the condition, the NPV decreases to 88.4% (see Figure 4-7). Again, this makes sense; when very few people have the condition, a negative screen is more likely to be accurate. When quite a few people have the condition, a negative screen is less likely to be accurate. Prevalence and NPV are measures that travel in opposite directions (see Figure 4-9).

Figure 4-8: Formula to Calculate Negative Predictive Value (NPV) From a 2 × 2 Table.

images/9781284254990_CH04_FIGF08.png

Figure 4-9: Relationship Between Prevalence and Predictive Values.

images/9781284254990_CH04_FIGF09.png

How These Characteristics Relate

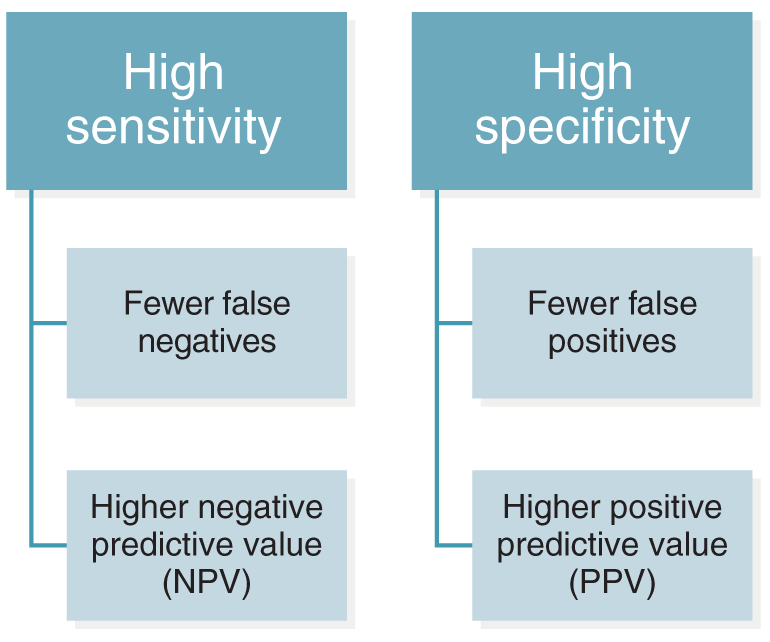
Sometimes you will hear clinicians say, “When you have a highly sensitive test, you can trust your negatives; when you have a highly specific test, you can trust your positives.” This is because higher sensitivity is associated with a higher NPV, and higher specificity is associated with a higher PPV.

The acronyms SnNout and SpPin are also used to remember these complex concepts:

  • SnNout—highly sensitive test with a negative result rules out the concern.
  • SpPin—highly specific test with a positive result rules in the concern.

Figure 4-9 shows you why these statements are true.

Efficiency

One last concept is particularly useful in a clinical setting. Efficiency (EFF) is a measure of the agreement between the screening test and the actual clinical diagnosis. To determine efficiency, add all the true positives and all the true negatives, and determine what proportion of your sample it is. (This proportion is the group that the test correctly identified, and therefore the diagnosis is made correctly. That is always a good thing in nursing!) Efficiency can be calculated by using the formula in Figure 4-10.

Figure 4-10: Formula for Calculating Efficiency (EFF).

images/9781284254990_CH04_FIGF10.png

Where Students Often Make Mistakes

There is one very common mistake that students make when they begin to set up their 2 × 2 tables. I have created a template in Figure 4-1 to help you avoid making this mistake. If you look at the table, you will see boxes A, B, C, and D within the 2 × 2 grid. But there are more boxes outside the 2 × 2 grid where the row and column totals go. Students often forget these outside totals and try to put the numbers that should go in the outer total boxes within the 2 × 2 grid. I added the outer total boxes to try to remind students of these placeholders and prevent this common error. When you dissect a word problem involving a 2 × 2 table, remember that you must know both the disease status and the screen/test status for any numbers that go within the 2 × 2 grid (boxes A, B, C, or D). If you only know the disease status or the screen/test status, that is a row or column total and should be outside the 2 × 2 grid.

It makes perfect sense until you try to apply it to a word problem, and then it is easy to get mixed up, so practice, practice, practice. If you don’t set up the table correctly, you won’t get the correct answers, no matter how good you are at the calculations. I also highly suggest having extra blank copies of Figure 4-1 available as you work through these types of problems. (You will do something similar in Chapter 13, so get good at them now and save yourself some headaches.)

Here are a few to try. When you read the individual statements, decide where that information should go in a 2 × 2 table, just like you would if it were part of a word problem you had to dissect. Use Figure 4-1 as a guide.

Study A: Sixty-seven people developed tuberculosis. In this case, you only know the disease status. This is the total of the “Disease Present” column, outside of the 2 × 2 grid (A + C).

Study B: One hundred and ninety-eight people tested positive for COVID. In this case, you only know the screen/test status. This is a total of the “Test Positive” row, outside of the 2 × 2 grid (A + B).

Study C: Forty-five people screened positive, but only 14 had the disease. This one can confuse you because there’s a lot of information here. Forty-five is the total number who screened positive, regardless of their disease status. That means this is a row total for those who test positive (A + B). It goes outside of the 2 × 2 grid. Of the 45 who screened positive, 14 also were disease positive. That means that “14” goes into box A within the 2 × 2 grid. It is the number of true positives. You should also do some math and know that if 45 people screened positive and 14 had the disease, 45 - 14 = 31 screened positive and did not have the disease. That means “31” goes into box B within the 2 × 2 grid.

Study D: One thousand and seventy-six true positives were identified. True positives are subjects who have the disease and test positive. You know both the disease and test status. This number goes into box A within the 2 × 2 grid.

Study E: Eight hundred and seven were enrolled in the study, and 39 had terminal cancer. The total number of subjects goes in the bottom-right corner outside of the 2 × 2 grid (A + B + C + D). We know the disease status for 39, but we don’t know their test status. That means this group is a column total for those with the disease (A + C), outside the 2 × 2 grid. Again, we can now do some additional math. We know that 807 subjects were in the study and 39 had the disease, which means 807 - 39 = 768 subjects did not have the disease. This is the second column total (B + D) for those without the disease and is recorded outside of the 2 × 2 grid.

You will have the chance to keep practicing setting up these tables in the chapter review exercises. Take your time and approach the problems methodically. If you dissect the information slowly and carefully, you will be able to set up your 2 × 2 table correctly and answer the questions that follow it.

Summary

You have completed the chapter and are doing a great job! Let’s recap the main ideas.

Validity is the accuracy of your measurement. To assess content validity, determine the relevant variables from a thorough literature search, include them in your measurement instrument, and have your instrument reviewed by experts for feedback. For convergent validity, compare your results with those of another previously validated survey that measured the same thing. Divergent validity is the opposite: it measures the opposite variable of a previously validated measurement and finds the opposite result.

Reliability tells you whether your measurement tool is consistent or repeatable. Stability is one of the main factors that contribute to reliability and is the consistent or enduring quality of the measure. Another component or type of reliability is homogeneity, or the extent to which items on a multi-item instrument are consistent with one another. Also, equivalence reliability tells you whether multiple forms or multiple users of an instrument produce the same results.

Nurses like to know the sensitivity and specificity of screening tests. Sensitivity is the probability of getting a true positive, and specificity is the probability of getting a true negative. The prevalence of the illness in a population affects a screening test’s positive and negative predictive values.

Again, great work for completing this difficult chapter. If you are somewhat confused by these new concepts, continue to practice, practice, practice! Believe it or not, you will look back on these concepts at the end of the semester, and they will make sense.

Review Questions

  1. Your test is very good at correctly identifying when a person actually has a disease. Your test is a measure of which of the following?
    1. Sensitivity
    2. Specificity
    3. Collinearity
    4. Effect size

    Show Answer

  2. If a person has a disease and tests positive for it, the result is an example of which of the following?
    1. A true negative
    2. A false positive
    3. A false negative
    4. A true positive

Questions 3-4: You are studying a new screening test. Of the 100 people who do not have a disease, 80 test negative for it with your new screen. Of the 100 people who do have the disease, 90 test positive with your screen.

  1. The sensitivity of your screen is ___________.

    Show Answer

  2. Your new screen’s specificity is ___________.

  3. You have a new tool that examines outcomes in pregnancy. A previously validated tool reports that the cesarean section rate in your area is 30%. The correlation between the old tool and your tool is 0.7. This result indicates which of the following?

    1. Convergent validity
    2. Content validity
    3. Divergent validity
    4. Validity from contrasting groups

    Show Answer

Questions 6-13: You are developing a new screening test and construct the test results shown in Table 4-1.

Table 4-1: A 2 × 2 Table

Disease Present

Disease Not Present

Totals

Test Positive

44

3

47

Test Negative

6

97

103

Totals

50

100

150

  1. How many true positives do you have?

  2. Without using statistics jargon, explain what each box represents.

    Show Answer

  3. What is the sensitivity of your new test?

  4. What is the specificity of your new test?

    Show Answer

  5. Give an example of a clinical situation in which this might be a good test to use.

  6. What is the positive predictive value of your screening test?

    Show Answer

  7. What is the prevalence rate of the disease you are testing for?

  8. If this disease were fatal, would you be concerned about this prevalence rate?

    Show Answer

Research Application

Questions 14-17: A small study was done to compare the results from three different chlamydia screening tests. The results obtained are shown in Table 4-2.

Table 4-2: A 2 × 2 Table for Chlamydia Screen

Sensitivity

Specificity

PPV

NPV

Screen A

57

96

66

94

Screen B

85

82

37

98

Screen C

57

94

57

94

  1. Which screen has the lowest specificity? Why might it still be a good screen to use?

  2. Which screen has the highest positive predictive value? If you administered this screen in a population with a high prevalence, what would you expect to happen to the positive predictive value?

    Show Answer

  3. If you know that early treatment helps prevent infertility and that chlamydia is very contagious, would sensitivity or specificity be more important to you? With that in mind, which of these tests would you prefer to utilize?

  4. If all the tests are administered in the same manner and cost the same, which one would you recommend that your clinic use? Justify your answer.

    Show Answer

Questions 18-23: You are using a screening test in your clinic to detect abnormal cervical cells related to the presence of human papillomavirus (HPV). Your results are shown in Table 4-3.

Table 4-3: Screen Test Results

Abnormal Cells Present

Abnormal Cells Not Present

Totals

Test Positive

360

20

380

Test Negative

40

80

120

Totals

400

100

500

  1. What is the prevalence of abnormal cells in your clinic? What does this mean in nonstatistical language, or plain English?

  2. What is the sensitivity of the screen? What does this mean in nonstatistical language, or plain English?

    Show Answer

  3. What is the specificity of the screen? What does this mean in nonstatistical language, or plain English?

  4. What is the positive predictive value (PPV) of the screen? What does this mean in nonstatistical language, or plain English?

    Show Answer

  5. What is the negative predictive value (NPV) of the screen? What does this mean in nonstatistical language, or plain English?

  6. What is the efficiency of the screen? What does this mean in nonstatistical language, or plain English?

    Show Answer

Questions 24-31: A new vaccine is developed that provides immunity to the virus causing abnormal cervical cells, and you reexamine the data 2 years after the vaccine is implemented at your clinic. See the results in Table 4-4.

Table 4-4: Screening Test Results After Vaccine Implementation

Abnormal Cells Present

Abnormal Cells Not Present

Totals

Test Positive

180

60

240

Test Negative

20

240

260

Totals

200

300

500

  1. What is the prevalence of abnormal cervical cells after the vaccine is utilized? How did the vaccine affect the prevalence?

  2. What is the sensitivity of the screen? Does a change in prevalence affect the sensitivity?

    Show Answer

  3. What is the specificity of the screen? Does a change in prevalence affect the specificity?

  4. What is the PPV of the screen? Does a change in prevalence affect the PPV? If so, how?

    Show Answer

  5. What is the NPV of the screen? Does a change in prevalence affect the NPV? If so, how?

  6. What happens to the number of false positives when the prevalence rates go down?

    Show Answer

  7. What happens to the efficiency of the screen when the prevalence rates go down?

  8. Why might you consider lengthening the time between screens or developing a more specific screen with the new prevalence rate?

    Show Answer

  9. Melanomas are the deadliest form of skin cancer, affecting more than 53,000 Americans each year and killing more than 7000 annually. Your state currently has 167 cases of melanoma reported, and there are 1,420,000 people in the state. What is the prevalence rate in your state?

Questions 33-39: A clinical study is established to determine if the results of a screening stress test can be used as a predictor of the presence of heart disease. The study enrolls 100 participants who undergo a screening stress test and then have their disease state confirmed by an angiogram (gold standard). Twenty participants screened positive with their stress tests and had confirmed heart disease on their angiograms. One participant who screened positive on his stress test had a normal angiogram and did not have heart disease. Seventy-seven participants screened negative on their stress tests and had normal angiograms without heart disease.

  1. Develop an appropriate 2 × 2 table illustrating this information.

    Show Answer

  2. What is the sensitivity of the screening stress test? What does this mean in nonstatistical language, or plain English?

  3. What is the specificity of the screening stress test? What does this mean in nonstatistical language, or plain English?

    Show Answer

  4. What is the PPV of the screening stress test? What does this mean in nonstatistical language, or plain English?

  5. What is the NPV of the screening stress test? What does this mean in nonstatistical language, or plain English?

    Show Answer

  6. What is the disease prevalence in this sample?

  7. What is the efficacy of this screen?

    Show Answer

  8. You have developed a new buccal swab test for hepatitis C and enroll 1388 subjects to test the screen. There are 941 people who do not have hepatitis C and test negative with your screen. There are 388 people who test positive with your screen. There are 435 subjects with confirmed cases of hepatitis C, and 59 test negative. Complete the appropriate 2 × 2 table and use it to answer the following questions.

    images/9781284254990_CH04_UNFIGF01.png
  9. You are studying a new screening instrument and determine the following after screening 135 people. Of the 60 individuals who are known to have the disease, 58 screen positive. One person without the disease screens positive. Seventy-four people without the disease screen negative. Which of the following statements is true?

    1. The disease has a negatively correlated attack rate of 44%.
    2. Each additional exposure is likely to be associated with a sevenfold increase in your outcome variable.
    3. The efficiency of the screen is approximately 88%.
    4. If a person screens positive, there is a 98% chance that he or she actually has the disease.

    Show Answer

  10. You are studying a new screening instrument and determine the following after screening 135 people. Of the 60 individuals who are known to have the disease, 58 screen positive. One person without the disease screens positive. Seventy-four people without the disease screen negative. Which of the following statements is true?

    1. The disease has a negatively correlated attack rate of 44%.
    2. Each additional exposure is likely to be associated with a tenfold increase in your outcome variable.
    3. If the person screens negative, there is a 97% chance that he or she does not have the disease.
    4. If a person screens positive, there is a 77% chance that he or she actually has the disease.
  11. You are studying a new screening instrument and determine the following after screening 135 people. Of the 60 individuals who are known to have the disease, 58 screen positive. One person without the disease screens positive. Seventy-four people without the disease screen negative. Which of the following statements is true?

    1. The specificity of the screen is higher than the sensitivity of the screen.
    2. Each additional exposure is likely to be associated with a tenfold increase in your outcome variable.
    3. If the person screens negative, there is a 79% chance that he or she does not have the disease.
    4. If a person screens positive, there is a 77% chance that he or she actually has the disease.

    Show Answer

  12. You are studying a new screening instrument and determine the following after screening 135 people. Of the 60 individuals who are known to have the disease, 58 screen positive. One person without the disease screens positive. Seventy-four people without the disease screen negative. What is the efficiency of the screening test?

    1. 98%
    2. 96%
    3. 99%
    4. 44%

Questions 45-51: You are studying a new antigen screen for COVID-19 called Rapid Run. You screen 500 asymptomatic athletes in the Olympic Village and follow up with the gold standard of diagnostic testing (polymerase chain reaction [PCR]). You determine the following about the Rapid Run screen. There are 100 athletes who have COVID, but only 53 screen positive with the Rapid Run screen; 388 athletes without COVID screen negative. A total of 65 athletes screen positive with the Rapid Run screen. Answer the following questions.

  1. How many false negatives do you have with the Rapid Run screen?

    Show Answer

  2. What is the probability the test will be positive if the athlete actually has COVID?

  3. What is the probability of a true negative?

    Show Answer

  4. If an athlete tests negative, what are the chances that the athlete does not have COVID?

  5. What is the probability that the screen is correct?

    Show Answer

  6. One of the divers has a positive screen and is put into isolation until the PCR results are available. If he does have the disease, he will not be eligible to compete. He wants to know the probability that he has the disease. What do you tell him?

  7. What is the prevalence rate of COVID in this sample?

    Show Answer

Questions 52-58: The Olympic Committee is pleased with how well your screen is performing. They ask you to now screen any symptomatic athletes with the Rapid Run before the follow-up PCR testing is done. Over the 10 days of competition, you screen 78 symptomatic athletes in the Olympic Village. After the follow-up PCR testing is completed, you are able to determine the following about the Rapid Run screen. Fifty-four athletes do not have COVID-19. A total of 60 athletes screen negative. Seven athletes have a false-negative screen, and one athlete has a false-positive screen. Answer the following questions.

  1. What is the prevalence rate of the disease in this sample?

  2. Is the prevalence rate in this study higher or lower than the prevalence rate in the sample of asymptomatic athletes? How would you expect this to affect the PPV of the screen?

    Show Answer

  3. What is the PPV of the screen in your sample of symptomatic athletes? Is this consistent with what you would expect when applying the screen to a sample with this prevalence rate versus the prevalence rate in your previous sample?

  4. A basketball player screens negative and is reassured but still wants to know what the probability is that she really doesn’t have COVID. What do you tell her?

    Show Answer

  5. What is the probability that your screen is correct?

  6. If an athlete has COVID, is your screen more likely to be positive when the athlete is asymptomatic or symptomatic?

    Show Answer

  7. How many true positives do you have when you screen the symptomatic athletes?

Questions 59-60: You receive a follow-up grant to assess the accuracy of delayed screening with the Rapid Run in patients known to have a positive COVID PCR test. You complete the screen 6 days after their symptoms started in 89 patients with known COVID infection. Forty-four screen positive.

  1. What is the sensitivity of the screen 6 days after known infection?

    Show Answer

  2. Fill in the following table:

    Asymptomatic athletes

    Sensitivity =

    Symptomatic athletes

    Sensitivity =

    6 days after symptoms

    Sensitivity =

    Rapid Run Screening Sensitivity

    Is the screen more or less likely to detect infection in those who are infected when they are asymptomatic, symptomatic, or 6 days after symptoms start?

  3. A competing company releases the Baxter HALT COVID-19 antigen screen with the following sensitivity information. All other aspects of the screen are similar to the Rapid Run screen.

    Asymptomatic athletes

    Sensitivity = 67%

    Symptomatic athletes

    Sensitivity = 70%

    6 days after symptoms

    Sensitivity = 24%

    You are the medical director for a small school district in Upstate New York. Your school board would like your recommendation about which screen to use for asymptomatic athletes before teams are cleared to play high-contact indoor sports. What is your recommendation, and why?

    Show Answer

  4. You conduct a new newborn screening test for cystic fibrosis. The sensitivity is 98%, and the specificity is 70%. Are you more confident in your positive or negative screen results?

Computer Applications Using Statistical Software for Nonstatisticians

Short How-To Video for Intellectus Statistics Applications (available at https://www.intellectusstatistics.com/how-to-videos/):

Cronbach’s Alpha

Data Analysis Application:

Open your Intellectus Statistics Account and open the 4th edition 518 Data Set with the changes you previously made in place.

  1. Calculate the Cronbach’s alpha for DBP 3 and DBP 5. (Set your scale title to DBP3 and 5.)
  2. Calculate the Cronbach’s alpha for DBP 1 and DBP 6. (Set your scale title to DBP1 and 6.)
  3. Which is higher? Interpret what this means.
  4. Why might a researcher wish to calculate Cronbach’s alpha? Identify two situations where it would be useful.

Answers to Odd-Numbered Review Questions

1. a

3. 90%

5. a

7. 44 true positives, 3 false positives, 47 all positive tests, 6 false negatives, 97 true negatives, 103 all negative tests, 50 total with disease, 100 healthy total, 150 total population

9. 97 ÷ 100, 97%

11. 44 ÷ 47, 93.6%

13. Yes! A third of the population has the disease. That is a substantial disease burden.

15. Screen A—high prevalence increases PPV; therefore, the PPV would increase.

17. Answers will vary but should not include screen C, which has lower specificity and PPV than screen A and the same sensitivity and NPV.

19. 360 ÷ 400, 90% (If the patient has abnormal cervical cells, there is a 90% probability that the screen will be positive and detect the abnormal cells.)

21. 360 ÷ 380, 94.7% (Of all the patients who screen positive, 94.7% are patients who really have abnormal cervical cells.)

23. 440 ÷ 500, 88% (Eighty-eight percent of the time, the screen correctly identifies the patient’s disease state.)

25. 180 ÷ 200, 90% (stays the same)

27. 180 ÷ 240, 75% (PPV decreases when prevalence goes down! You are more likely to have false positives in areas with lower prevalence.)

29. False positives increase.

31. Answers will vary but should include the following: False positives create a financial burden because unnecessary services are provided. Also, there may be negative health impacts from the stress, anxiety, loss of work time, and any other unnecessary screens or procedures that result from the false-positive screen.

33.

Disease Is Present

No Disease

Total

Screen test positive

20

1

21

Screen test negative

2

77

79

Total

22

78

100

35. 77/78, 98.7%. When a subject does not have the disease, there is a 98.7% chance the screening test will say that the individual is disease-free.

37. 77/79, 97.5%. When a subject has a negative screening stress test, there is a 97.5% chance the individual does not have the disease.

39. 97/100, 97%

41. d

43. a

45. 47

47. specificity = 388/400 = 97%

49. EFF = (53 + 388)/500 = 88%

51. 100/500 = 20%

53. higher—higher prevalence will increase PPV

55. 53/60 = 88%

57. Symptomatic (sensitivity = 71% vs. 53% when asymptomatic)

59. 44/89 = 49%

61. Answers may vary but should include that the Baxter HALT has higher sensitivity in asymptomatic athletes (67% vs. 53%). The trade-off is lower sensitivity for screens administered 6 days after infection (24% vs. 49%).

Answers to Data Analysis Application questions can be found in the Instructor Resources accompanying this text.