Description
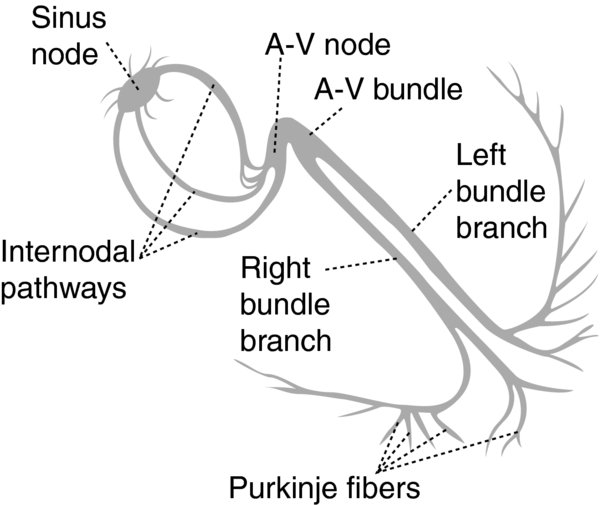
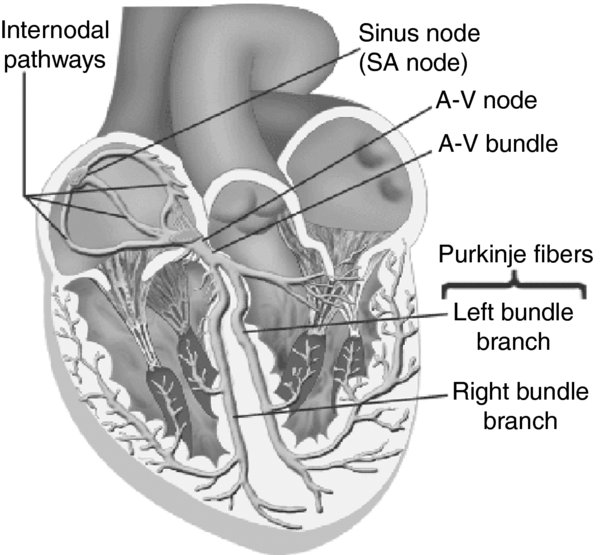
- In the mammalian heart, three major structures create rhythmical impulses are able to drive the heartbeat: The sinoatrial (SA) node, the atrioventricular (AV) node, the Purkinje fiber network.
- The SA node region serves as the primary (physiological) pacemaker, while the AV node Purkinje fibers serve as secondary (or accessory) pacemakers.
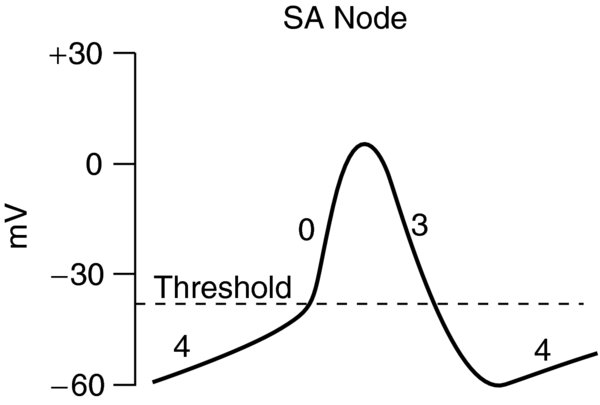
- Spontaneous (Phase 4) diastolic depolarization underlies the electrophysiological property of automaticity of cells in the SA AV nodes, His–Purkinje system, coronary sinus, possibly the pulmonary vein.
- SA node. Initiates the heart beat sets the rate rhythm of cardiac contraction. SA nodal cells are characterized as having no true resting potential, but instead generate regular, spontaneous action potentials.
- The ionic mechanism underlying the pacemaker depolarization is the activation of the hyperpolarization-activated current (If); this current is crucial in the generation of diastolic depolarization hence of spontaneous activity. Depolarizing current is carried into the cell primarily by relatively slow Ca2+ currents.
- The action potential, initiated in the center of node, propagates to the periphery of the node, then into the musculature of the terminal crest.
- In the center of the node, the action potential is slow small compared with the action potential in the surrounding atrial muscle.
- Autonomic regulation. The nodal region has an abundance of parasympathetic sympathetic nerve endings.
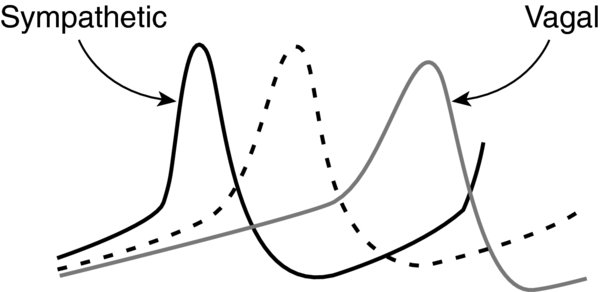
- Acetylcholine increases (makes more negative) the transmembrane resting potential reduces the spontaneous Phase 4 (diastolic) slope, thereby tending to reduce the rate at which depolarization occurs. Acetylcholine also tends to prolong refractoriness of SA node cells. Excessive parasympathetic influence may induce marked sinus bradycardia, sinus arrest, exit block.
- Catecholamines (norepinephrine epinephrine) increase the rate of Phase 4 depolarization, thereby increasing the sinus rate. The sympathetic autonomic nervous system (ANS) increases the heart rate may reverse sinus arrest SA exit block.
- During aging, the SA node structure undergoes remodeling associated with an augmentation of collagen content. Parasympathetic influence on SA node chronotropism progressively diminishes with increasing age. Maintenance of an appropriate heart rate chronotropic responsiveness in older individuals is increasingly dependent on the integrity of the sympathetic tone.
- AV node. From the SA node, the wave of depolarization spreads across the atria to the AV node. The AV node sets the appropriate frequency-dependent conduction delay between the atria ventricles. It also limits ventricular activation during atrial tachyarrhythmias, thereby protecting the ventricular rhythm.
- Action potentials have relatively low resting potentials, slow upstrokes (Ca2+ dependent), properties of refractoriness that persist well after repolarization has been completed (i.e., time-dependent refractoriness).
- Dromotropic responsiveness in the resting patient is under relatively balanced sympathetic parasympathetic neural influence. The relationship between ANS control of the SA rate AV conduction properties appears to foster both maintenance of 1:1 AV conduction a relatively optimal AV conduction interval.
- Parasympathetic predominance (i.e., sleep, very fit resting subjects) markedly enhances AV nodal dromotropic properties; in the extreme this can be associated with transient complete AV nodal block.
- AV node can become dominant in case of sympathetic block or failure.
- Purkinje fibers. His bundle bundle branches are composed of cells with larger surface area, more negative resting membrane potentials, faster (Na+ dependent) action potentials than those of the AV node.
- Automaticity in Purkinje fibers is slower than in the SA node AV node. Depending on the species considered, the pacemaking rate in Purkinje fibers varies between 25 40 beats/minute, which is usually sufficient to set a viable cardiac output.
- The Purkinje fibers network can pace the heart in cases of complete AV block.
- Action potentials propagate within thin Purkinje fiber bundles from base to apex before activation of the surrounding myocytes occurs.
- Purkinje fibers appear to be more resistant to ischemia than ordinary myocardial fibers.
- SA node. Situated laterally in the epicardial groove (less than 1 mm from the epicardial surface) of the sulcus terminalis near the right atrium–superior vena cava junction. In addition to the SA node, spontaneously active pacemaker cells can also be found in the area of the crista terminalis, the left right branch of the SA ring bundle, the interatrial septum.
- The SA node is a spindle-shaped structure with a fibrous tissue matrix that is comprised of closely packed cells with a wide variety of morphologies. Only the spindle- spider-shaped cells exhibit the typical electrophysiological characteristics of pacemaker cells.
- 10–20 mm long, 2–3 mm wide, thick, tending to narrow caudally toward the inferior vena cava.
- Besides pacemaker cells, the SA node also contains atrial cells, fibroblasts, adipocytes.
- Arterial supply to the SA node arises from the right coronary artery 55–60% of the time the left circumflex artery 40–45% of the time; this is often referred to as right or left dominance
- AV node. A superficial structure lying just beneath the right atrial endocardium, anterior to the ostium of the coronary sinus, directly above the insertion of the septal leaflet of the tricuspid valve.
- It is located at the apex of a triangle (triangle of Koch) formed by the tricuspid annulus the tendon of Todaro, which originates in the central fibrous body passes posterior through the atrial septum.
- The cells are small dispersed in a complex fibrous tissue matrix with relatively large extracellular space.
- Arterial supply to the AV node typically arises from a branch of the right coronary artery 80–85% of the time.
- Purkinje fibers. Cells are found in the His bundle bundle branches; they cover much of the endocardium of both ventricles. In humans, they penetrate only the inner 1/3rd of the endocardium. Purkinje fibers tend to be less concentrated at the base of the ventricle at the papillary muscle tips.
Physiology/Pathophysiology
- Sinus node dysfunction (sick sinus syndrome) includes the following:
- Abnormalities of sinus node impulse generation
- Disturbances of impulse emergence into the atrium
- Abnormal impulse transmission within the atria ( in some cases from the atria to the ventricles)
- Increased susceptibility to atrial tachycardias (particularly atrial fibrillation) chronotropic incompetence
- Inappropriate sinus tachycardia
- Persistent or inappropriate sinus tachycardia includes abnormal enhanced automaticity within the SA node or nearby atrial regions
- Bradycardia–tachycardia syndrome includes periods of bradyarrhythmia interspersed with bouts of atrial fibrillation, or less commonly other paroxysmal primary atrial tachycardias
- AV conduction disturbances include AV blocks (first degree, second degree, third degree)
- First- second-degree type 1 AV blocks are most often the result of conduction disturbances at the level of the AV node are frequently attributable to ANS influences.
- In the presence of a narrow QRS complex, first-degree AV block is due to AV nodal delay in more than 85% of patients due to delay within the His bundle in less than 15%.
- Complete heart block is almost always associated with structural heart disease , more often is associated with a wide QRS morphology.
- Drug effects
- Cardiac glycosides: First- or second-degree type 1 AV block occurs as a result of glycoside-induced enhanced vagal tone at the AV node.
- Beta-adrenergic blockers result in AV nodal conduction slowing, block, or both by diminishing sympathetic effects on the AV junction.
- Calcium channel blockers (particularly verapamil diltiazem) most antiarrhythmic drugs (especially from class 1C) act directly to slow conduction in the AV node.
- Quinidinedisopyramide manifest prominent vagolytic actions, which tends to counterbalance their negative dromotropic direct effects
- Loss of pacemaker activity from the SA node may result in circulatory collapse, necessitating the implantation of an electronic pacemaker.
- “Intrinsic” sinus node dysfunction is related to idiopathic degenerative fibrotic changes associated with the aging process.
- “Extrinsic” sinus node dysfunction can be caused by beta-adrenergic blockers, calcium channel blockers, membrane-active antiarrhythmics, digitalis.
- Drugs can alter SA node function as a result of direct pharmacologic effects (e.g., flecainide, sotalol, verapamil) or indirectly via the autonomic nervous system (e.g., beta-adrenergic blockers), or both (e.g., quinidine, disopyramide, propafenone, amiodarone, digitalis).
- Parasympathetic predominance can result in sinus bradycardia, sinus pauses, SA exit block, slow ventricular responses in atrial fibrillation.
- Assessment of SA node function:
- Responses to pharmacologic interventions (e.g., autonomic blockade)
- Neural reflexes (e.g., carotid sinus massage, Valsalva maneuver, heart rate response to upright tilt)
- Responses to induced hypotension (e.g., by administration of amyl nitrite)
FIGURE 1. Schematic organization of the pacemaker cells in the conduction system of the heart.
FIGURE 2. Anatomical localization of the pacemaker cells conduction system in the human heart.
The AV node tapers down into the bundle of His, which passes into the ventricular septum divides into two bundle branches, the left right bundles.
FIGURE 3. SA nodal action potentials are divided into three phases.
Phase 4 is the spontaneous depolarization (pacemaker potential) that triggers the action potential once the membrane potential reaches threshold between -40 -30 mV. Phase 0 is the depolarization phase of the action potential. This is followed by Phase 3 repolarization. Once the cell is completely repolarized at about -60 mV, the cycle is spontaneously repeated.
FIGURE 4. Effects of Parasympathetic (Vagal) Sympathetic Nerve Activation on SA Nodal Action Potentials.
Dashed line represents a normal action potential.


