You can either double-click the Excel icon on your desktop, if available, or select Microsoft Excel from the Start menu (Figure 4-1). Once you open Excel, the opening screen should resemble Figure 4-2.
Opening Excel from the Start menu.
A screenshot shows the selection of Microsoft Excel on clicking the Start button.
Courtesy of Windows © Microsoft 2020.
Opening screen of Excel.
A screenshot shows the opening screen of Excel.
Courtesy of Microsoft Excel © Microsoft 2020.
From the opening screen of Excel, you can create a new workbook or access your recent workbooks. You will locate and select “Blank Workbook” to open a new workbook, and click “Open Other Workbooks” to work on an existing workbook (Figure 4-3). Note that your recently edited workbooks will appear above “Open Other Workbooks.”
Selecting workbook in Excel.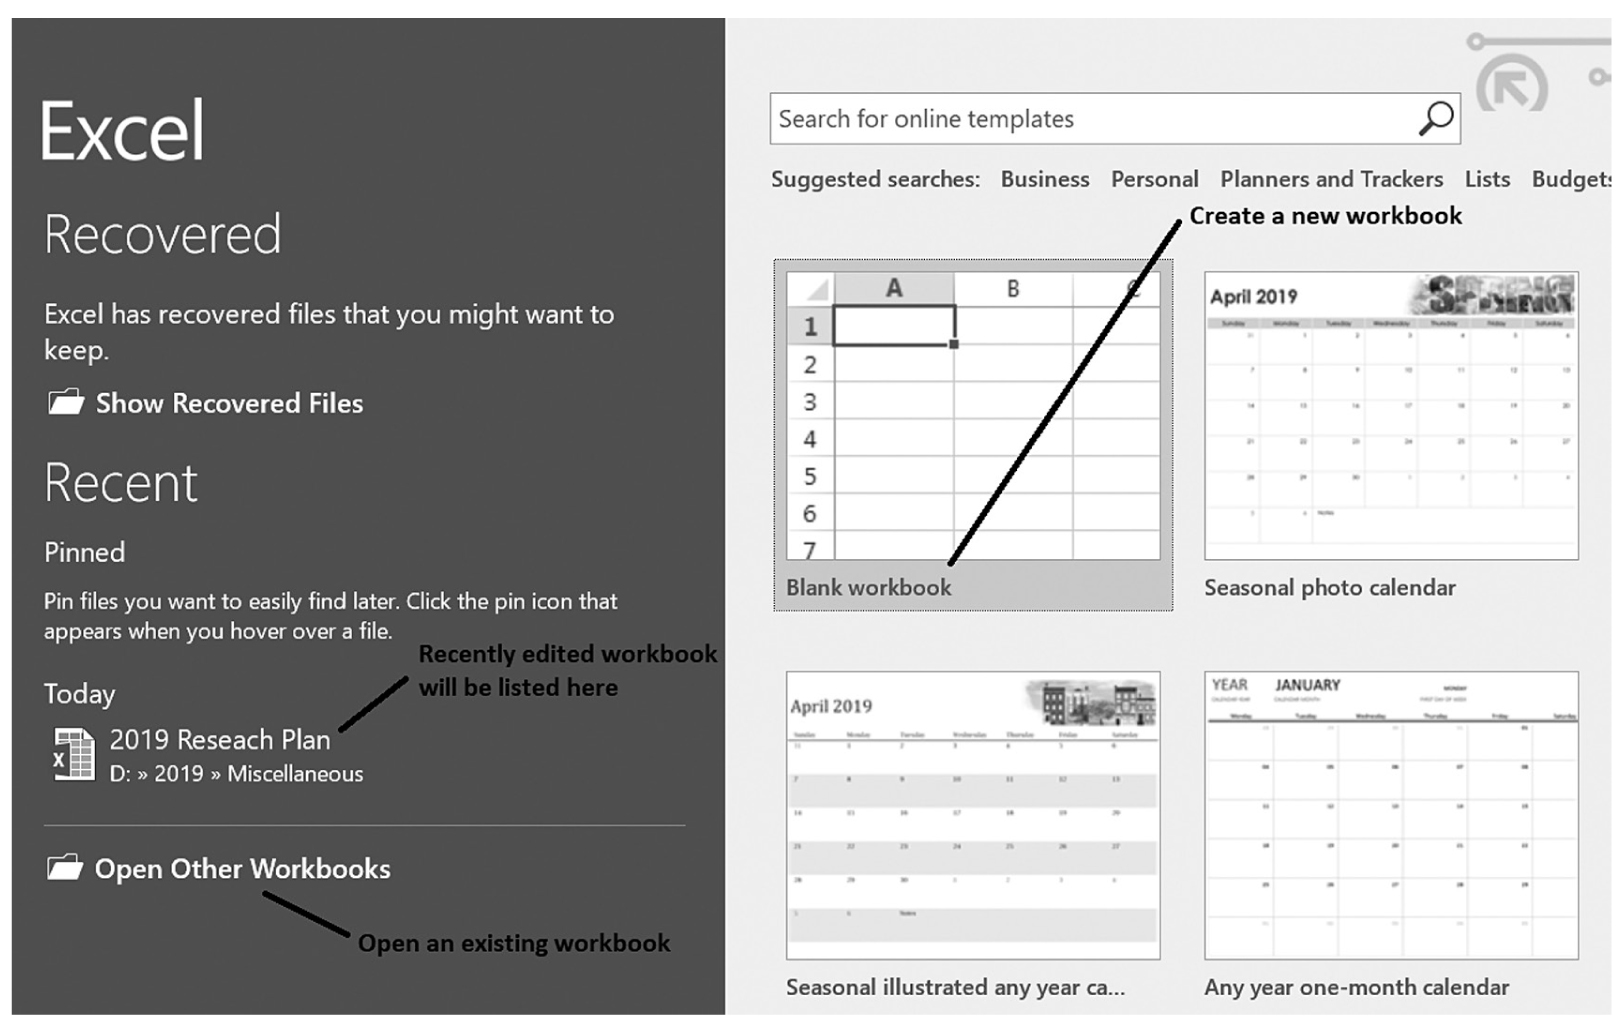
A screenshot shows the opening screen of Excel, and the selection of blank workbook template.
Courtesy of Microsoft Excel © Microsoft 2020.
The workbook window provides the space for a variety of workbook elements, such as the quick access toolbar and ribbon (Figure 4-4). There are many other elements that an investigator can utilize to help with data analysis, but we will discuss these as needed when we explain different types of statistical analyses.
Excel workbook elements.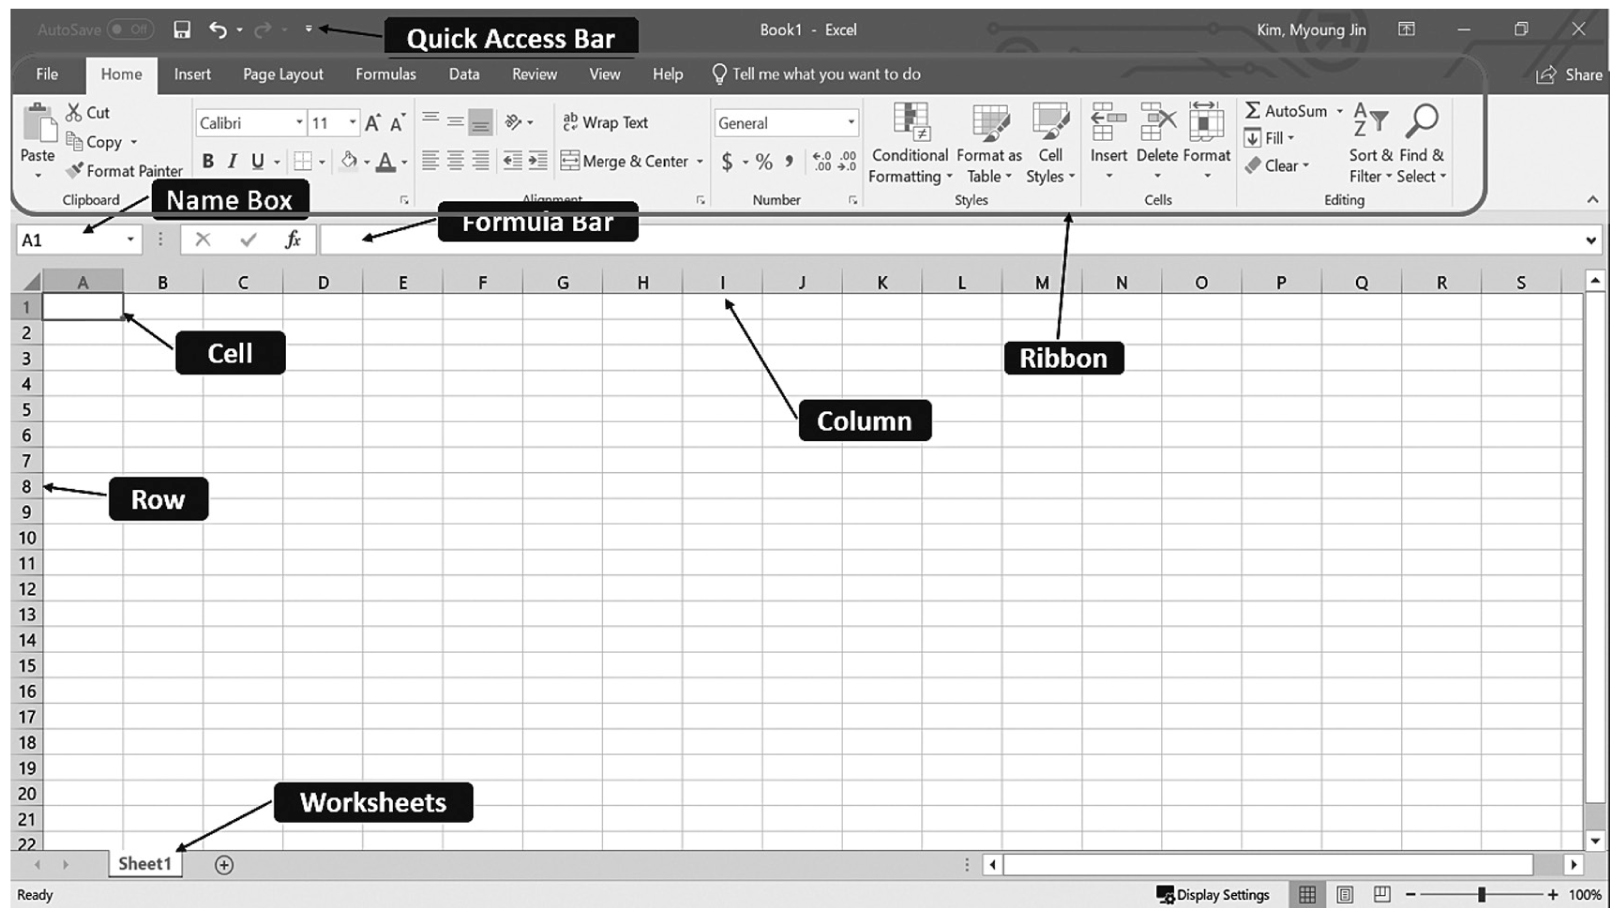
A screenshot of an Excel worksheet displays a variety of workbook elements.
Courtesy of Microsoft Excel © Microsoft 2020.
The Quick Access toolbar allows you to access common commands such as the Automatically Save, Save, Undo, and Redo commands by default. Other commands can be added simply by selecting the command(s) you wish to add from the drop-down menu or from “More Commands” (Figure 4-5). Note, however, the list can become too long and confusing, so we recommend you be selective.
Quick access toolbar.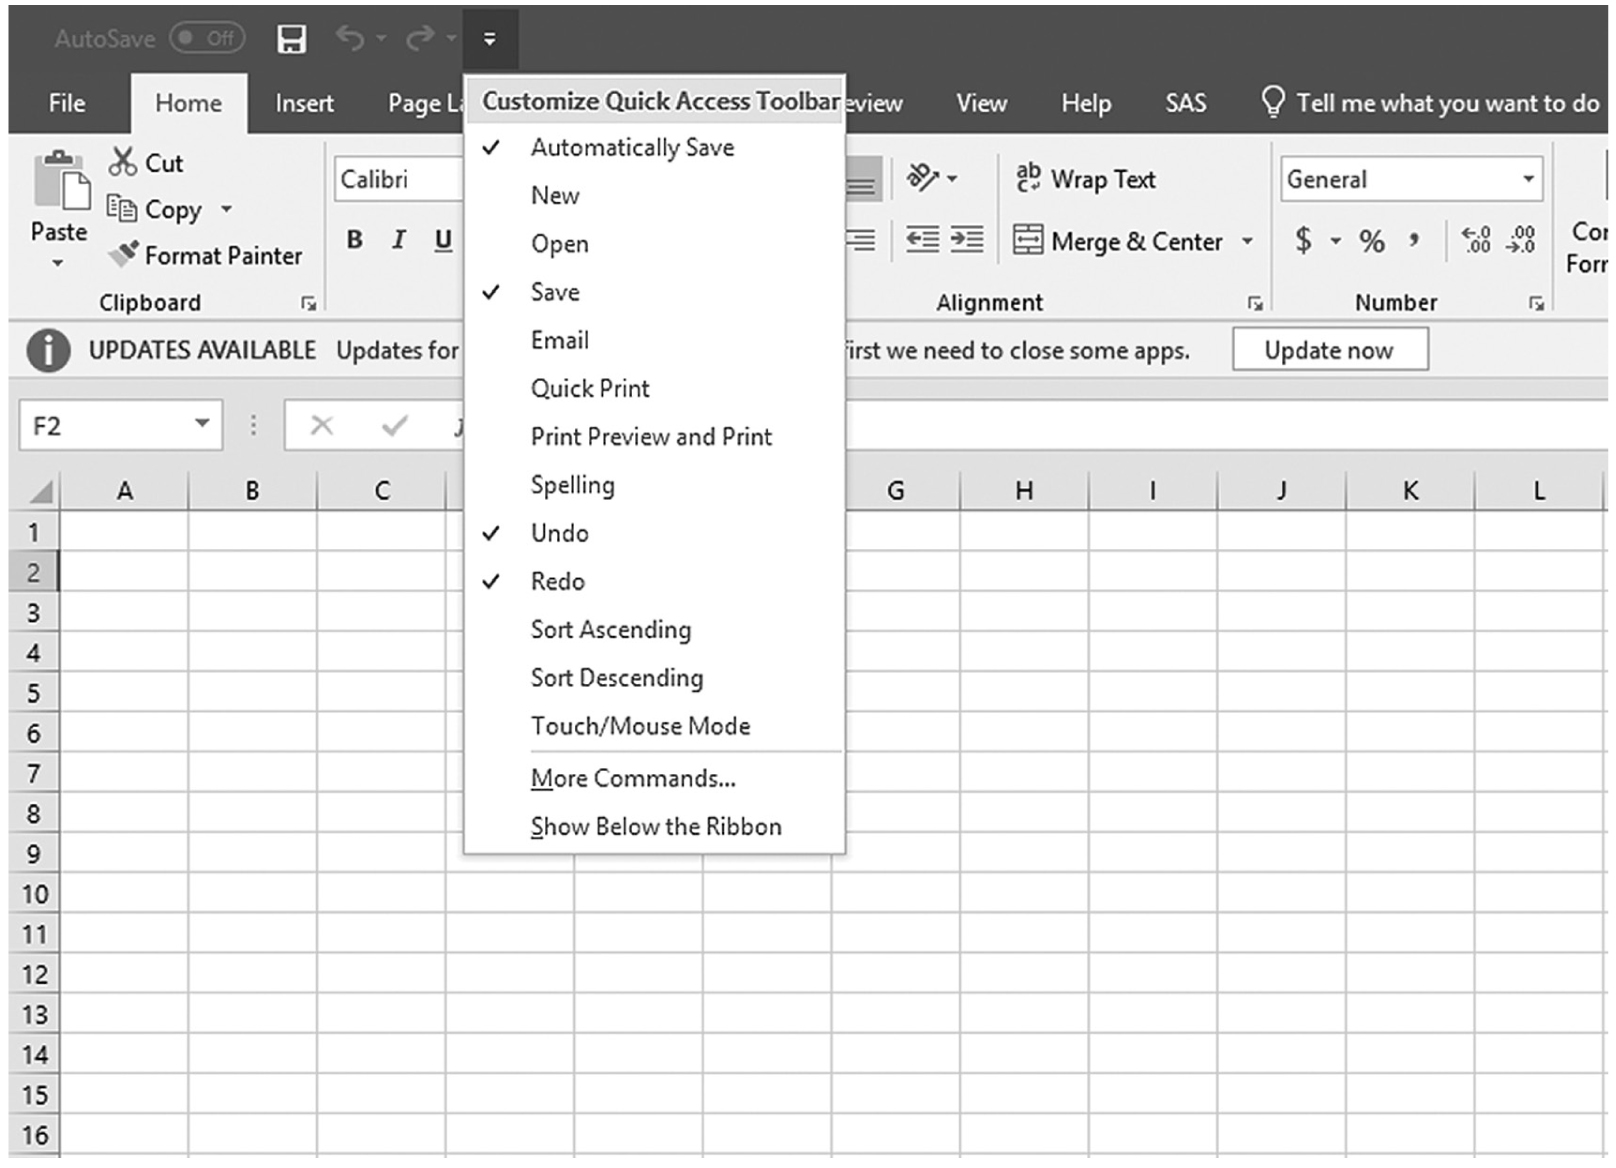
A screenshot of an Excel worksheet shows the list of tools of the quick access toolbar.
Courtesy of Microsoft Excel © Microsoft 2020.
The Ribbon is a toolbox at the top of the screen containing menus and commands that is designed to help you quickly access the commands you need to complete a task. Usually, the ribbons are arranged into three main parts, Tabs, Groups, and Commands (Figure 4-6). Tabs represent a general activity of area, each related to specific kinds of tasks that you perform. For example, “Home” has the tools most often used, such as Open, Save, and Print, and “Formula” has the tools to write functions to compute values. Groups are shown below Tabs and show related “Tools” together in logical groups under different Tabs. Commands are actual tools, which can be a button or expandable menu, that are organized into logical groups.
Parts of the ribbon.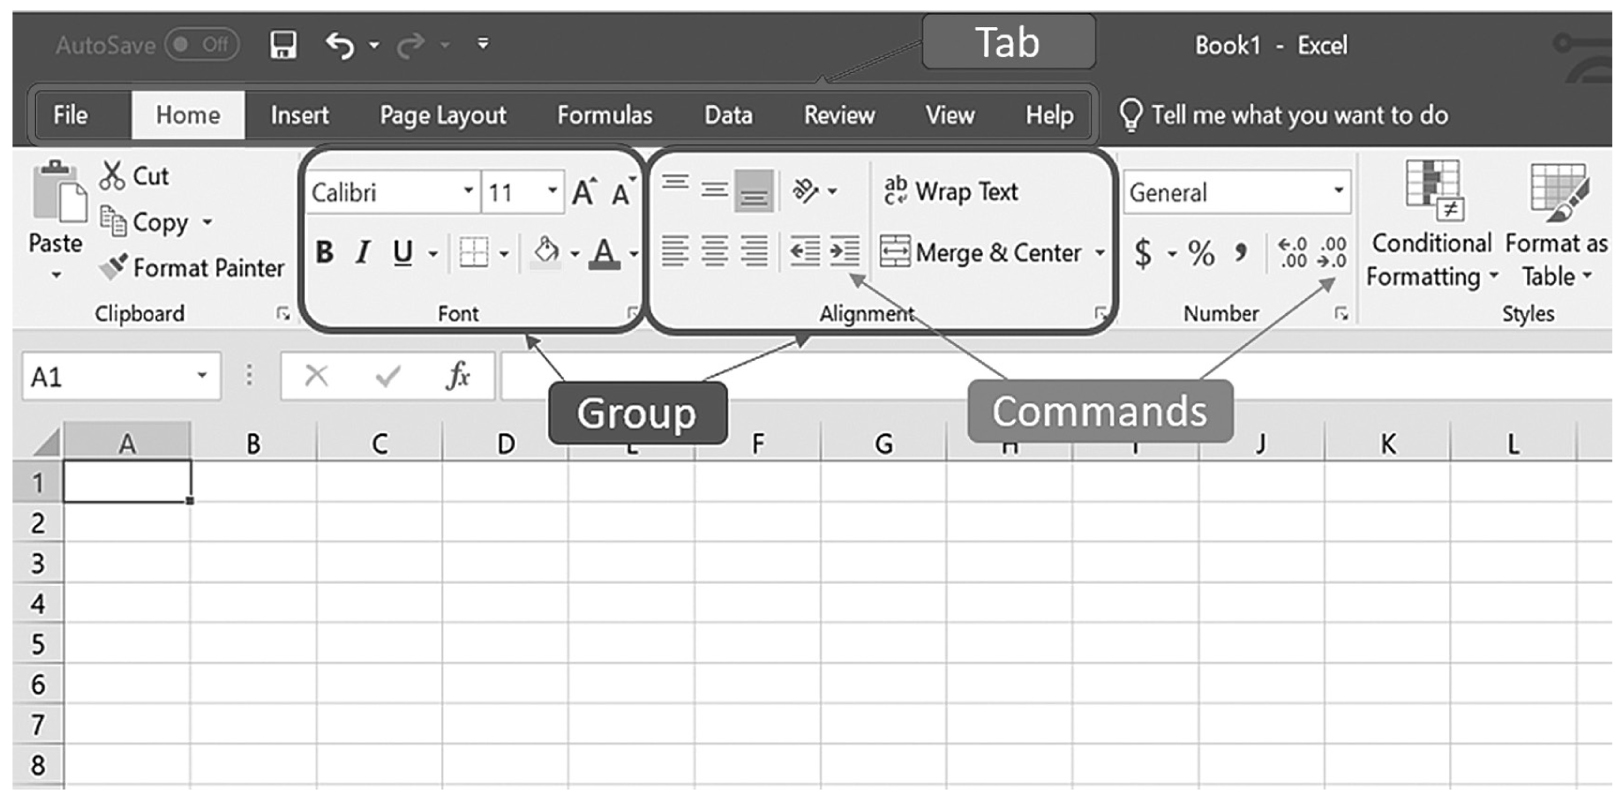
A screenshot of an Excel worksheet shows the parts of the ribbon of the Home menu, wherein the menu is divided into groups, namely, clipboard, font, alignment, number, and in turn each group consists of commands, namely cut, font, wrap text, autosum.
Courtesy of Microsoft Excel © Microsoft 2020.
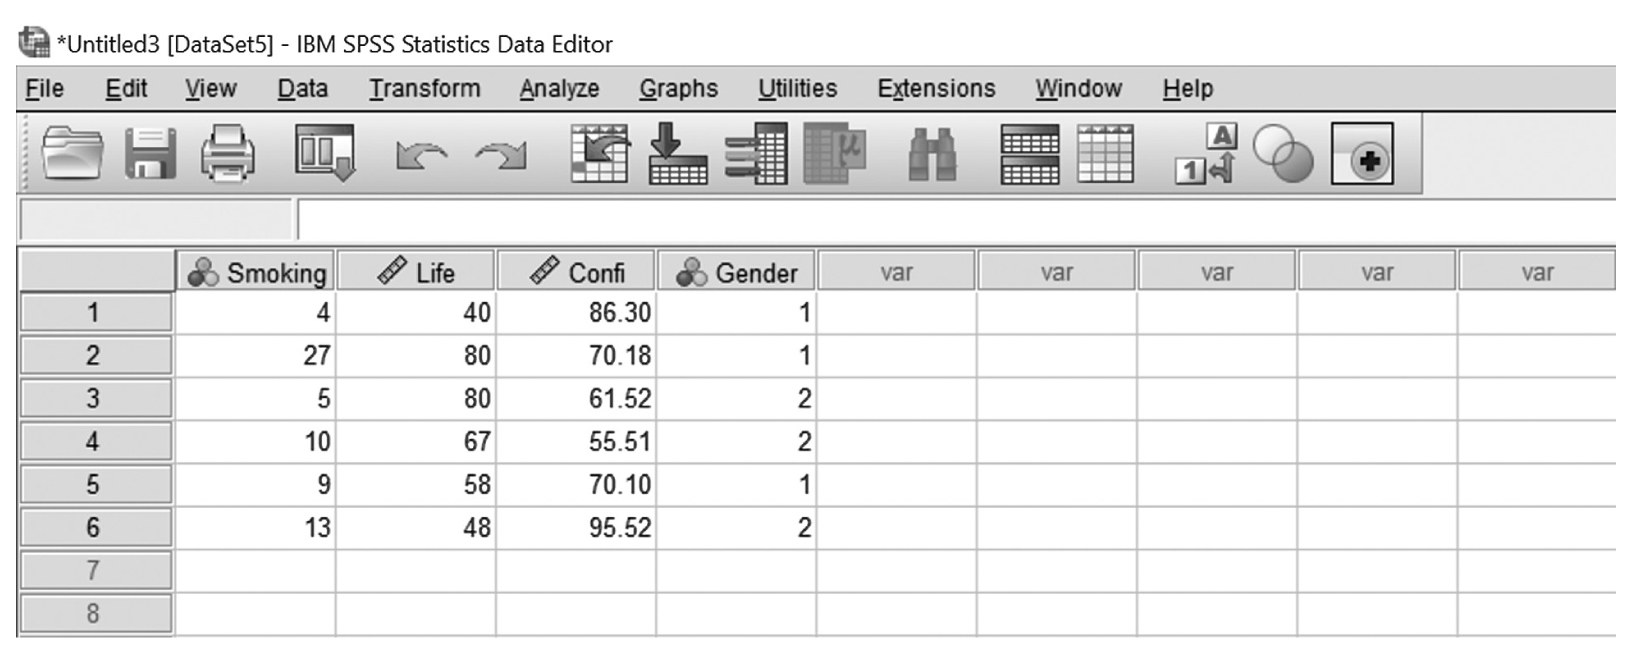
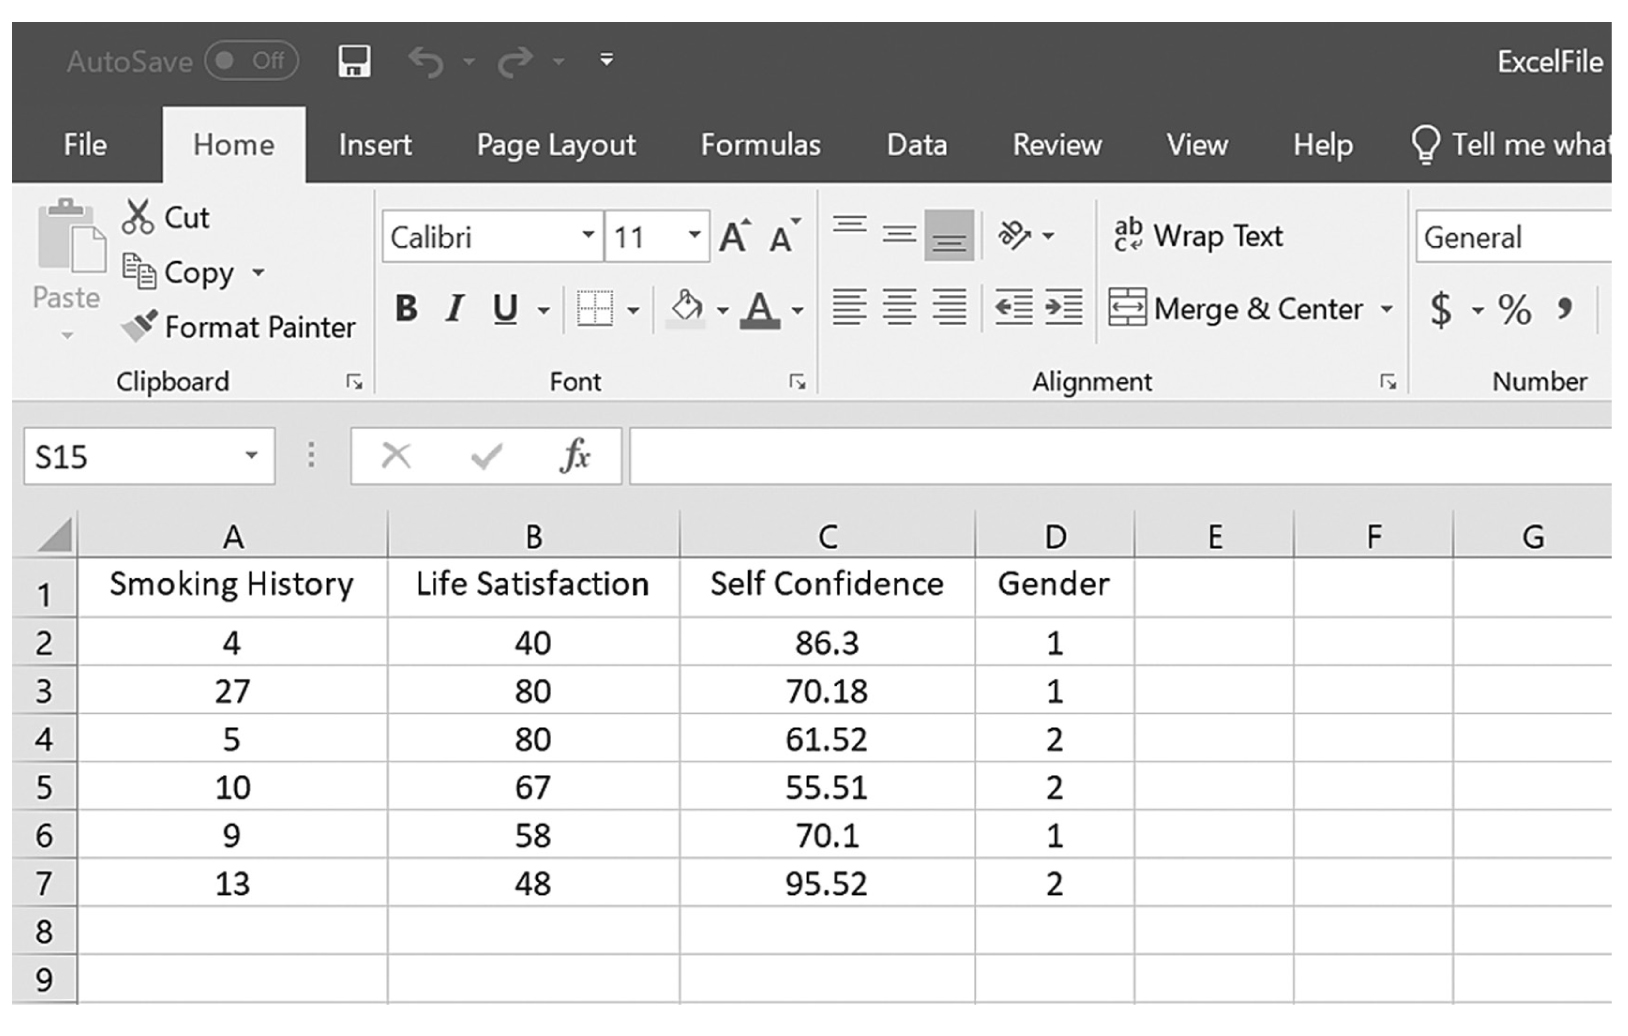
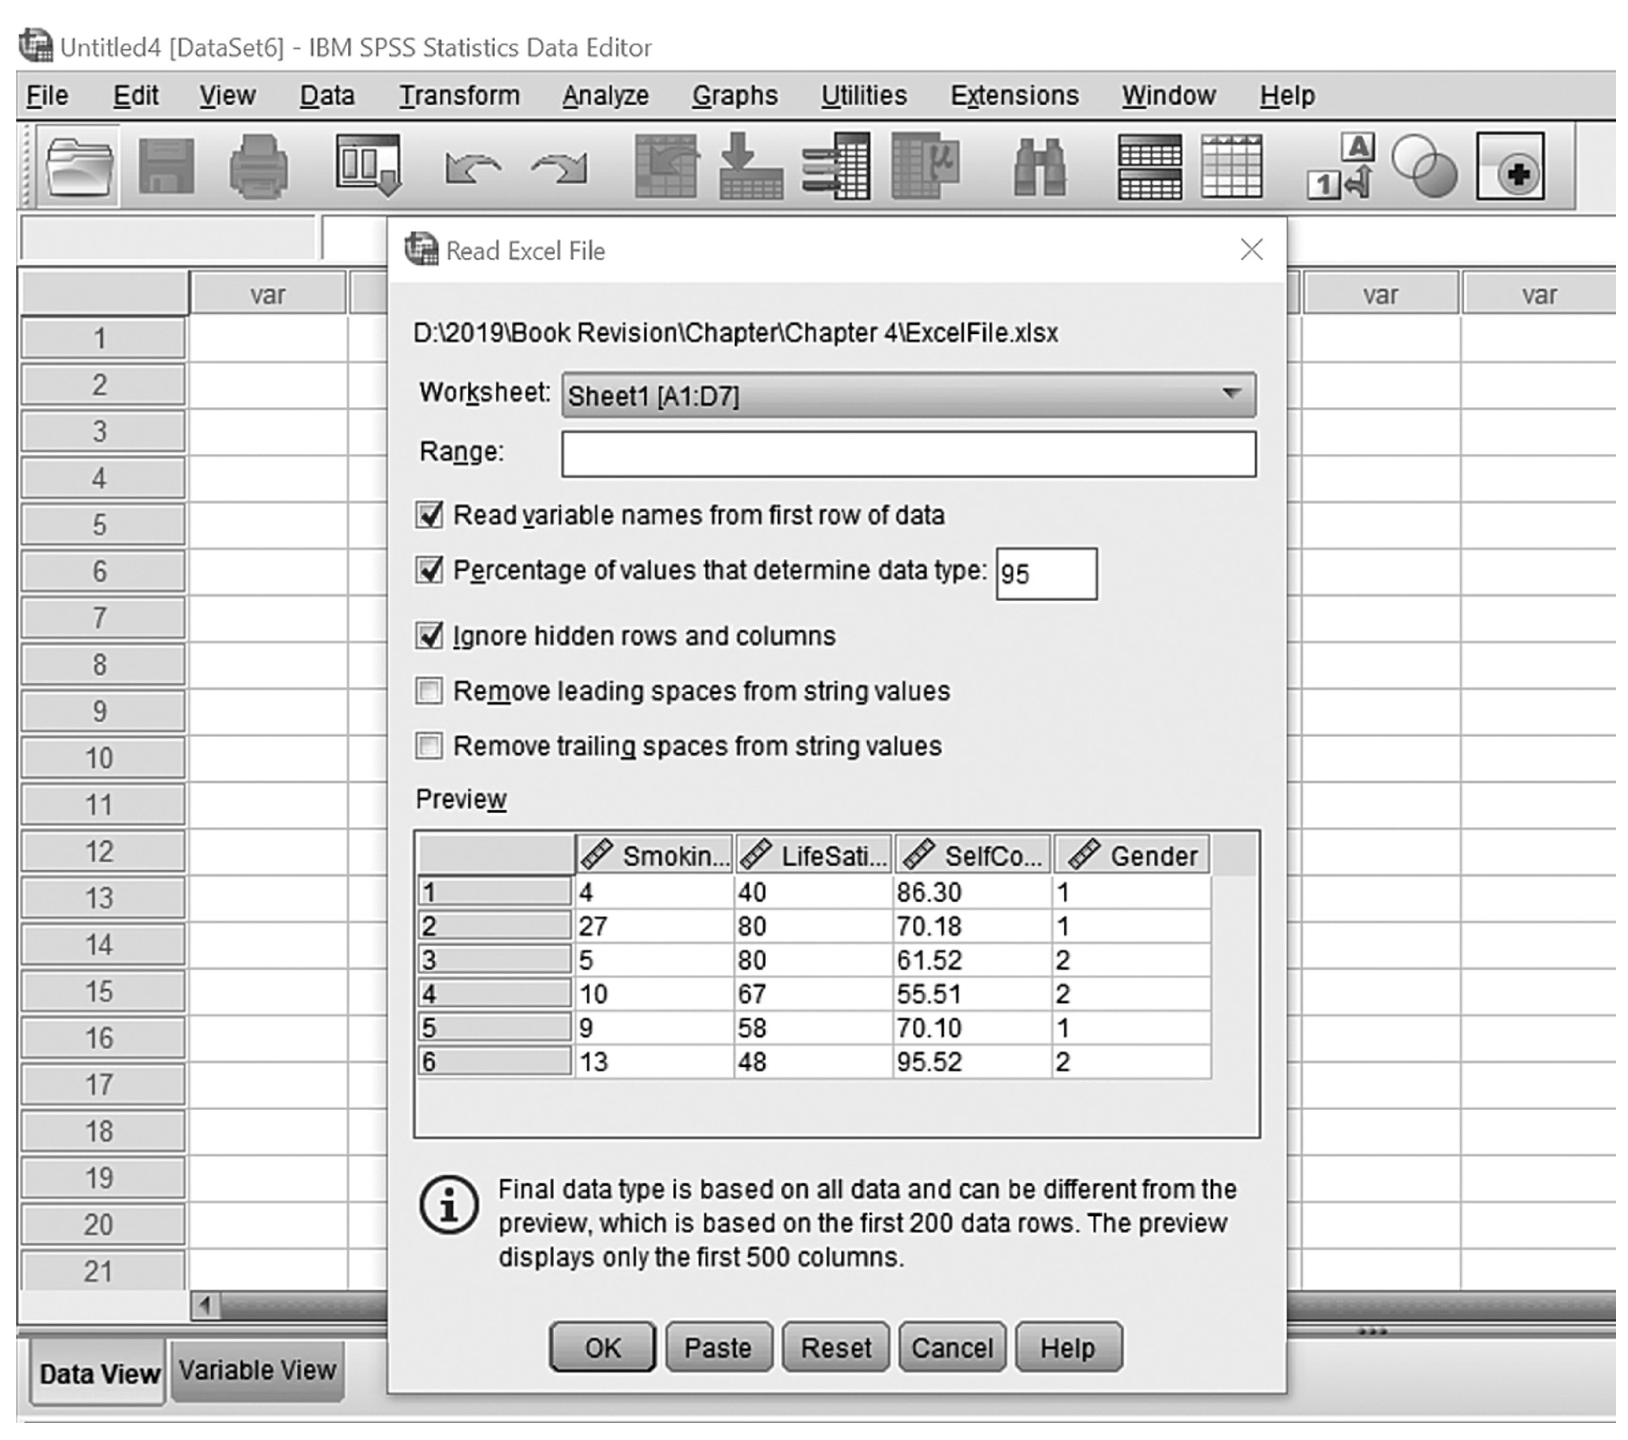
You can directly type data into a worksheet cell or copy and paste data from another worksheet or from other programs. To enter data, you can simply designate a cell and then type the data. You can press Enter to move to a cell in the next row, or Tab to move to a cell in the next column. Note that you can also move to another cell using the arrow keys. To copy and paste the data from another worksheet or from other programs, you can use copy from the right-click or the shortcut Ctrl+C on the cell to copy and then paste onto the desired cell using paste from the right-click or the shortcut Ctrl+V.
You can also import data in other formats, such as text, CSV, DBF3, or DBF4. Although there are other types of formats you can import into Excel, only text and CSV files are discussed here, as they are the most commonly imported files. Consider a situation in which your hospital admissions department keeps patient records using Microsoft Word. As a member of the shared governance in the hospital, you have been asked to identify the top 10 admission diagnoses and the length of stay for each of those admission diagnoses. Numerical data in a Word document may be imported into Excel to calculate a range of statistics that would help identify the most common diagnoses.
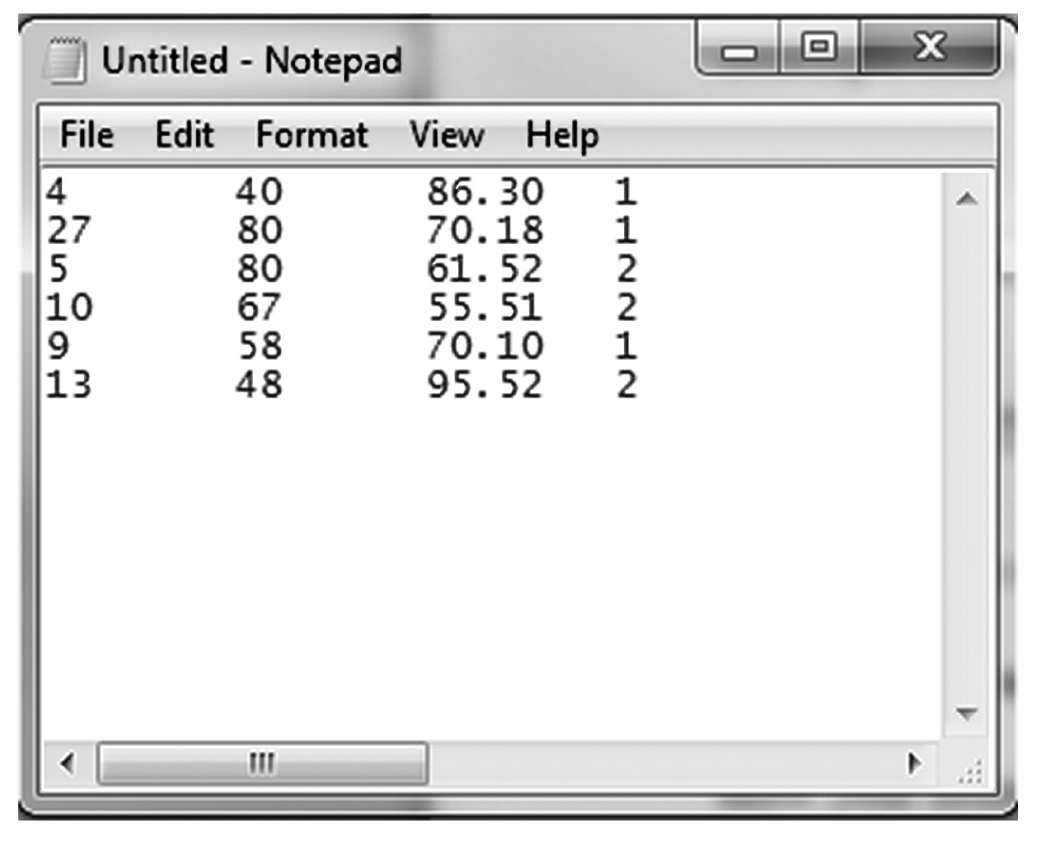
Text data are composed of contents directly inputted from the computer keyboard and can be easily imported to all computer software. Figure 4-7 shows the same example data.
Text data file.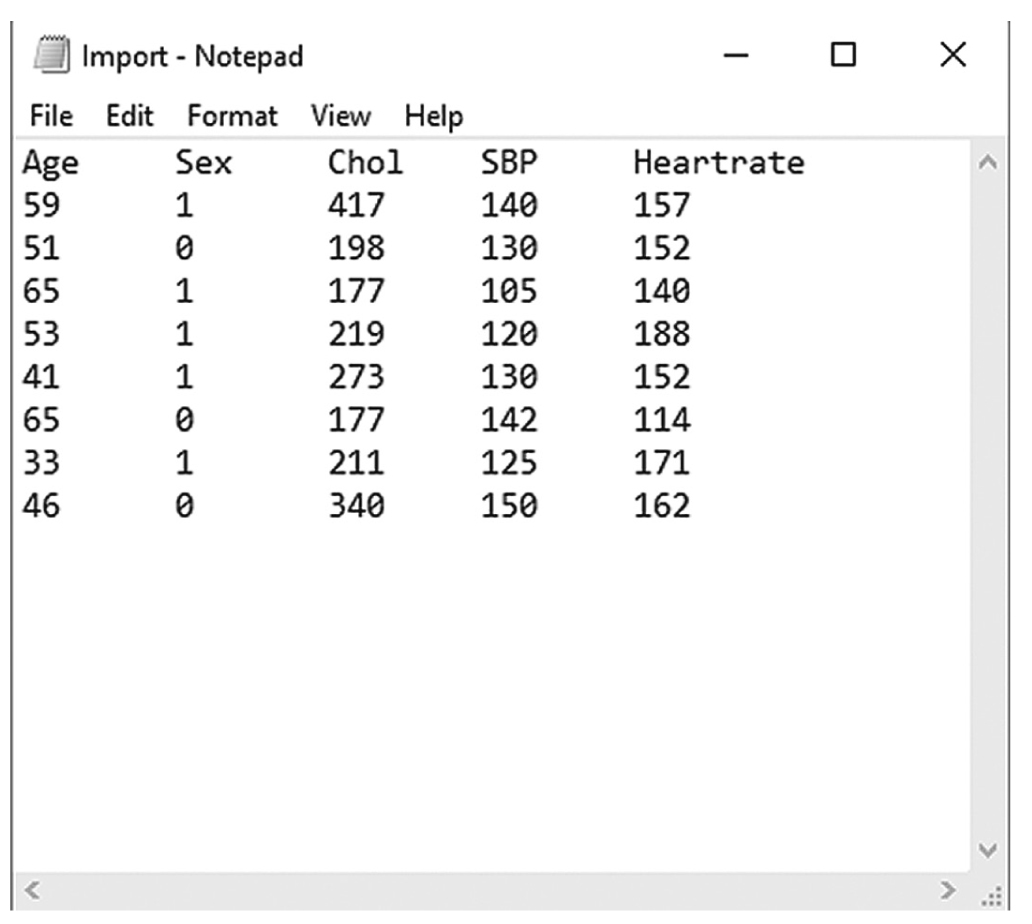
A screenshot of a Notepad file titled, Import, shows five columns with headings, Age, Sex, Cholesterol, S B P, and Heart rate, and eight rows of numerical data under each column.
Courtesy of Windows Notepad © Microsoft 2020.
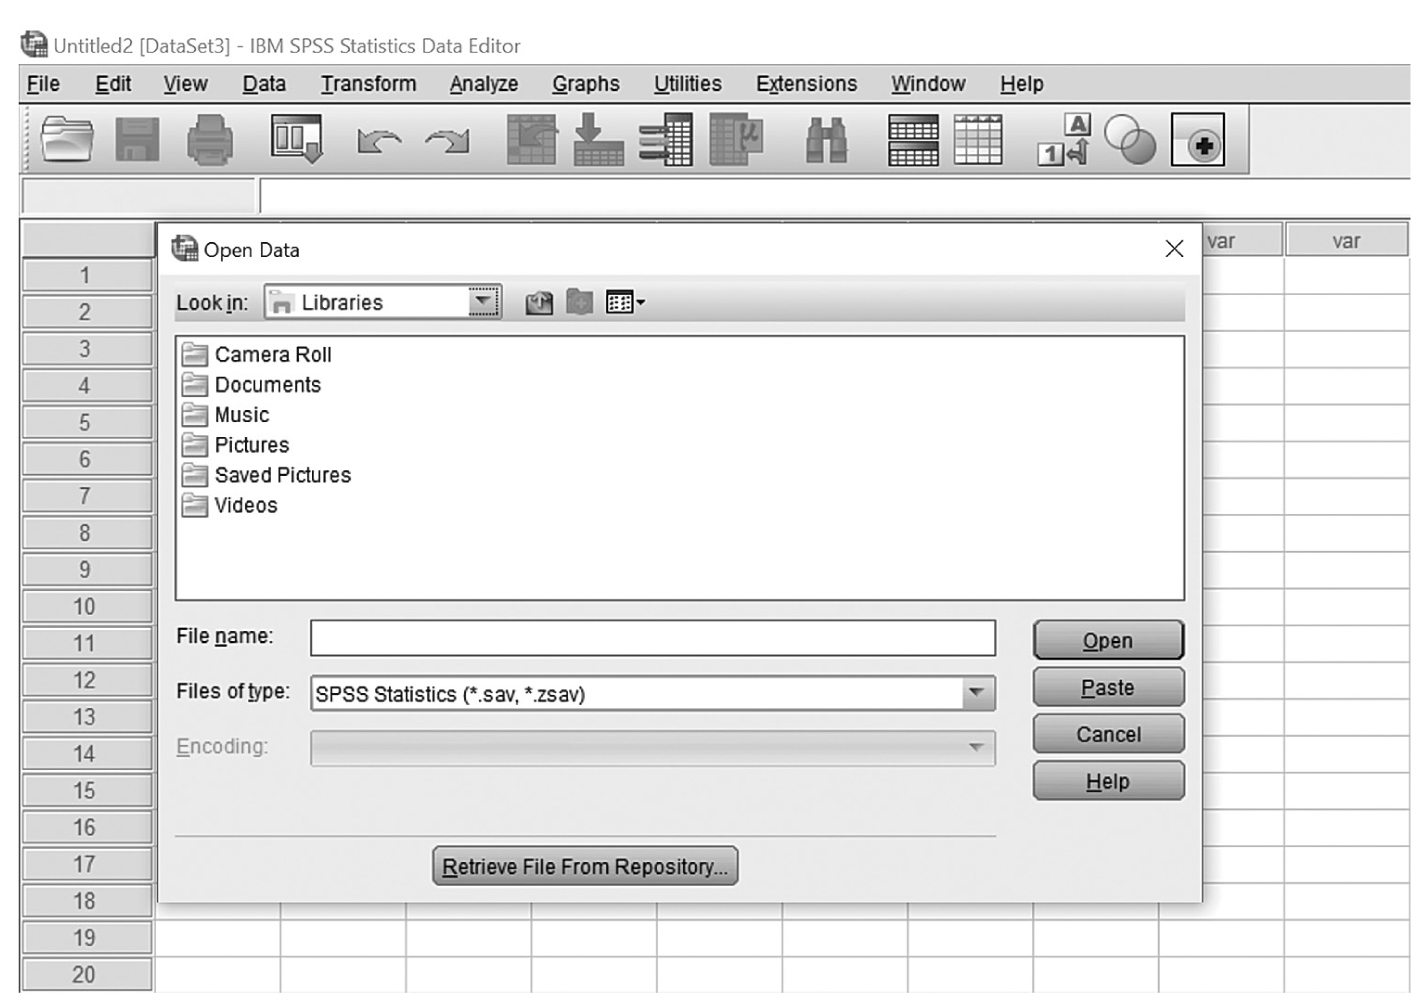
To import text, first go to File > Open > Browse. A new window (Figure 4-8) will appear. (Figures 4-9 to 4-11 show the additional screens.) Once you locate where the file was saved, change “Files of Type” from All Excel Files to All Files to show your desired text file. Select TextFile.txt and click “Open.”
Locating and opening the desired file.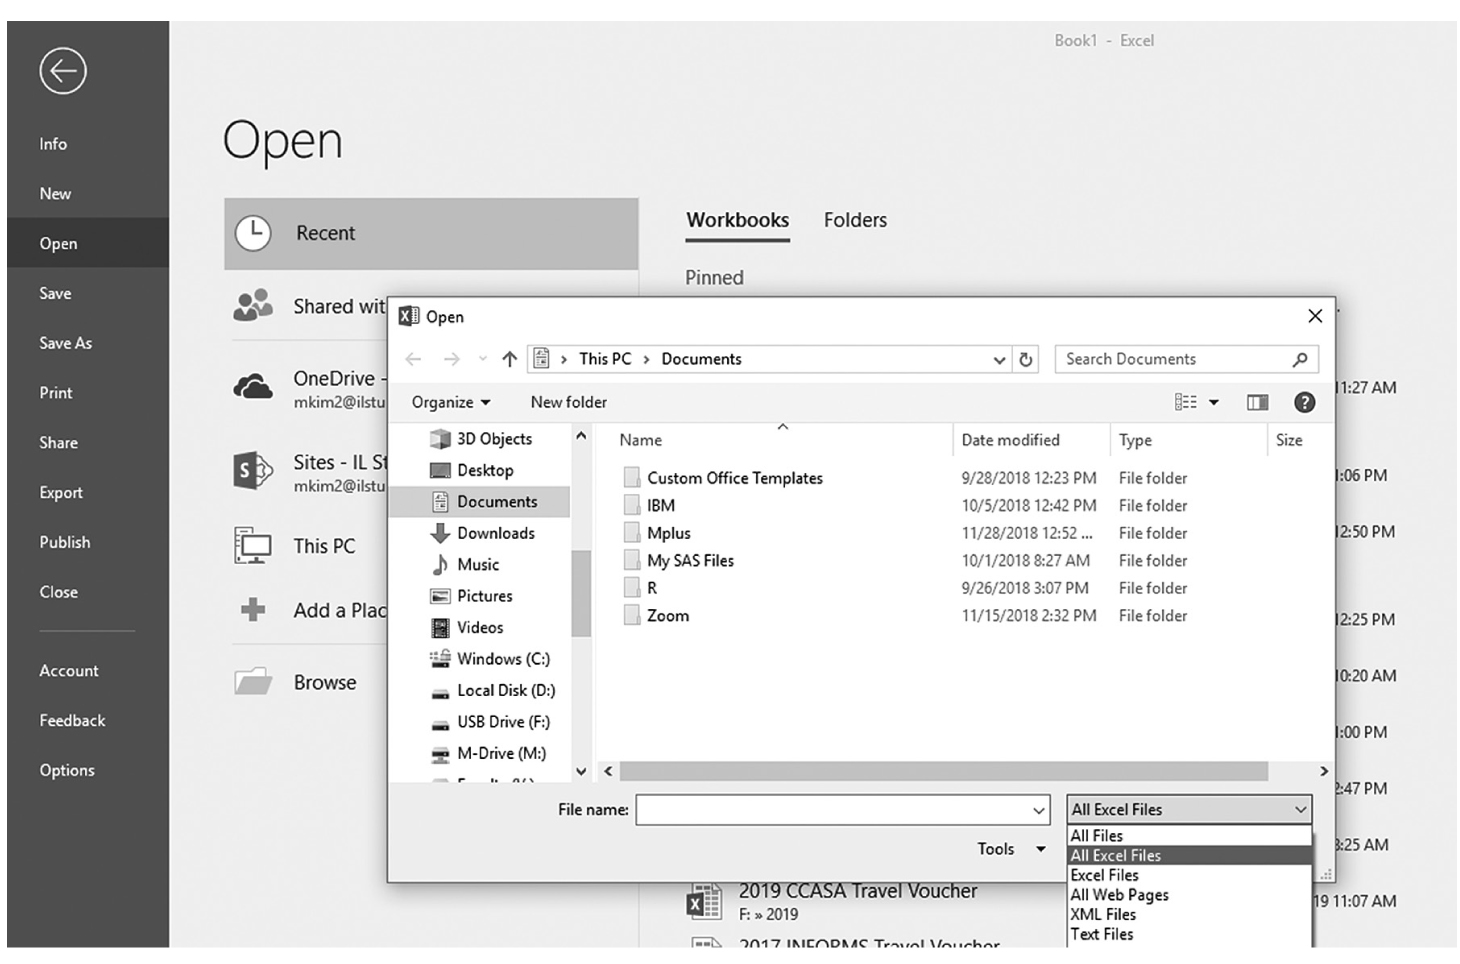
A screenshot shows the Open command in Excel selected, and the Open dialog box displayed.
Courtesy of Microsoft Excel © Microsoft 2020.
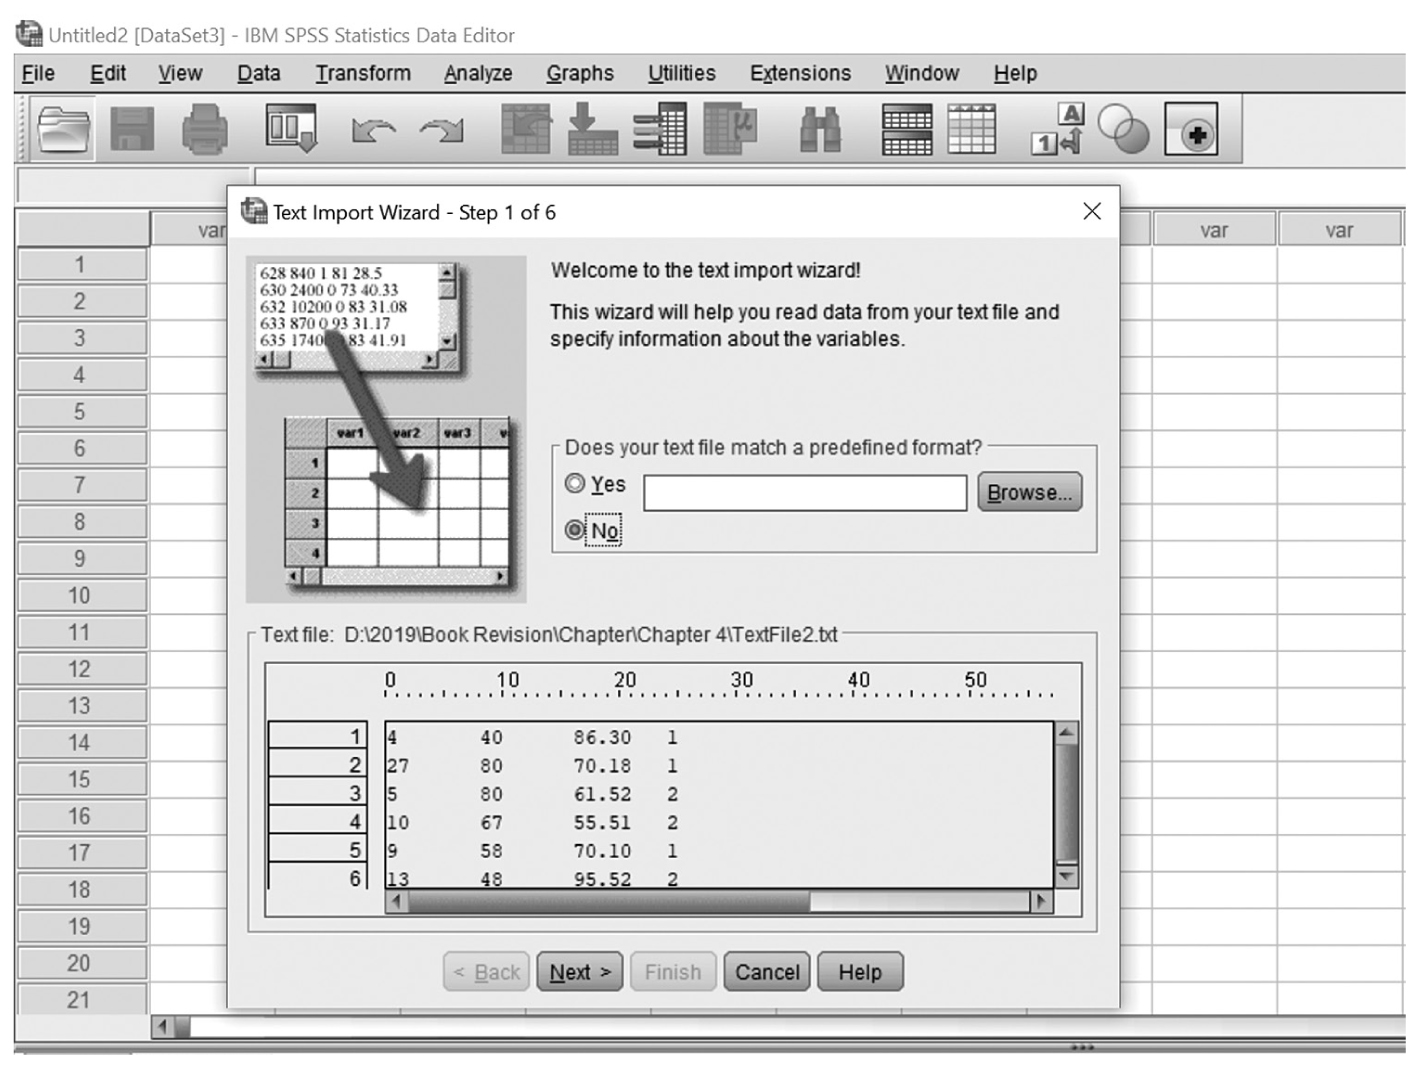
Text import wizard, step 1.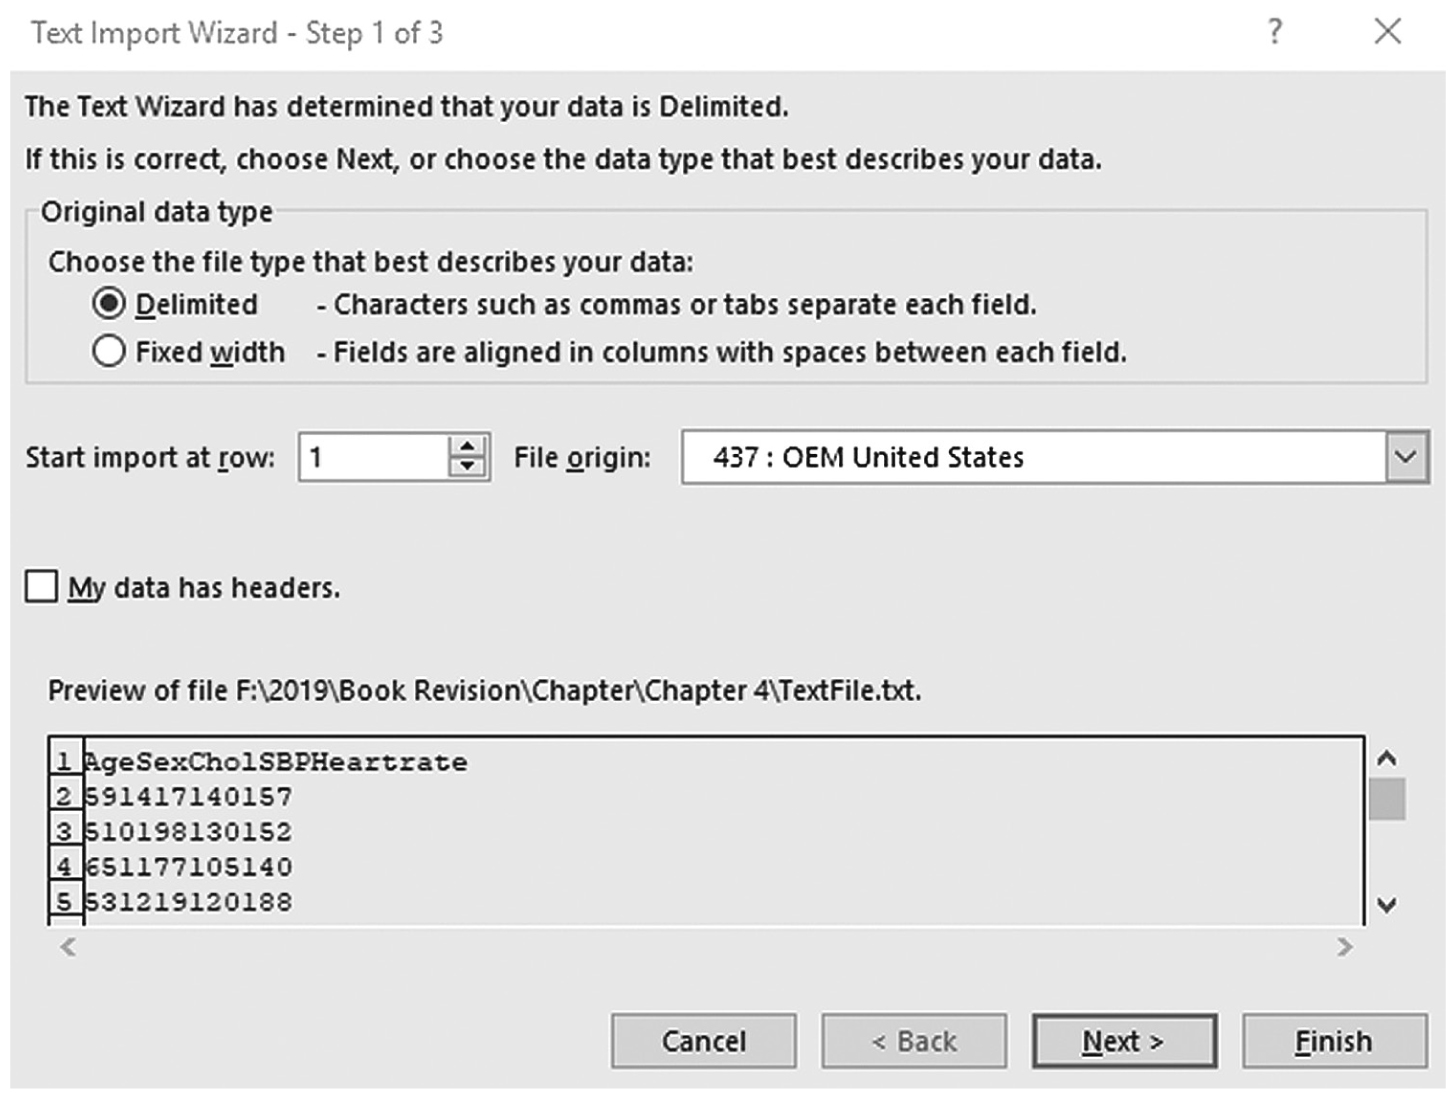
A screenshot of a window that displays the first of the three steps of the Text import wizard of an Excel file.
Courtesy of Microsoft Excel © Microsoft 2020.
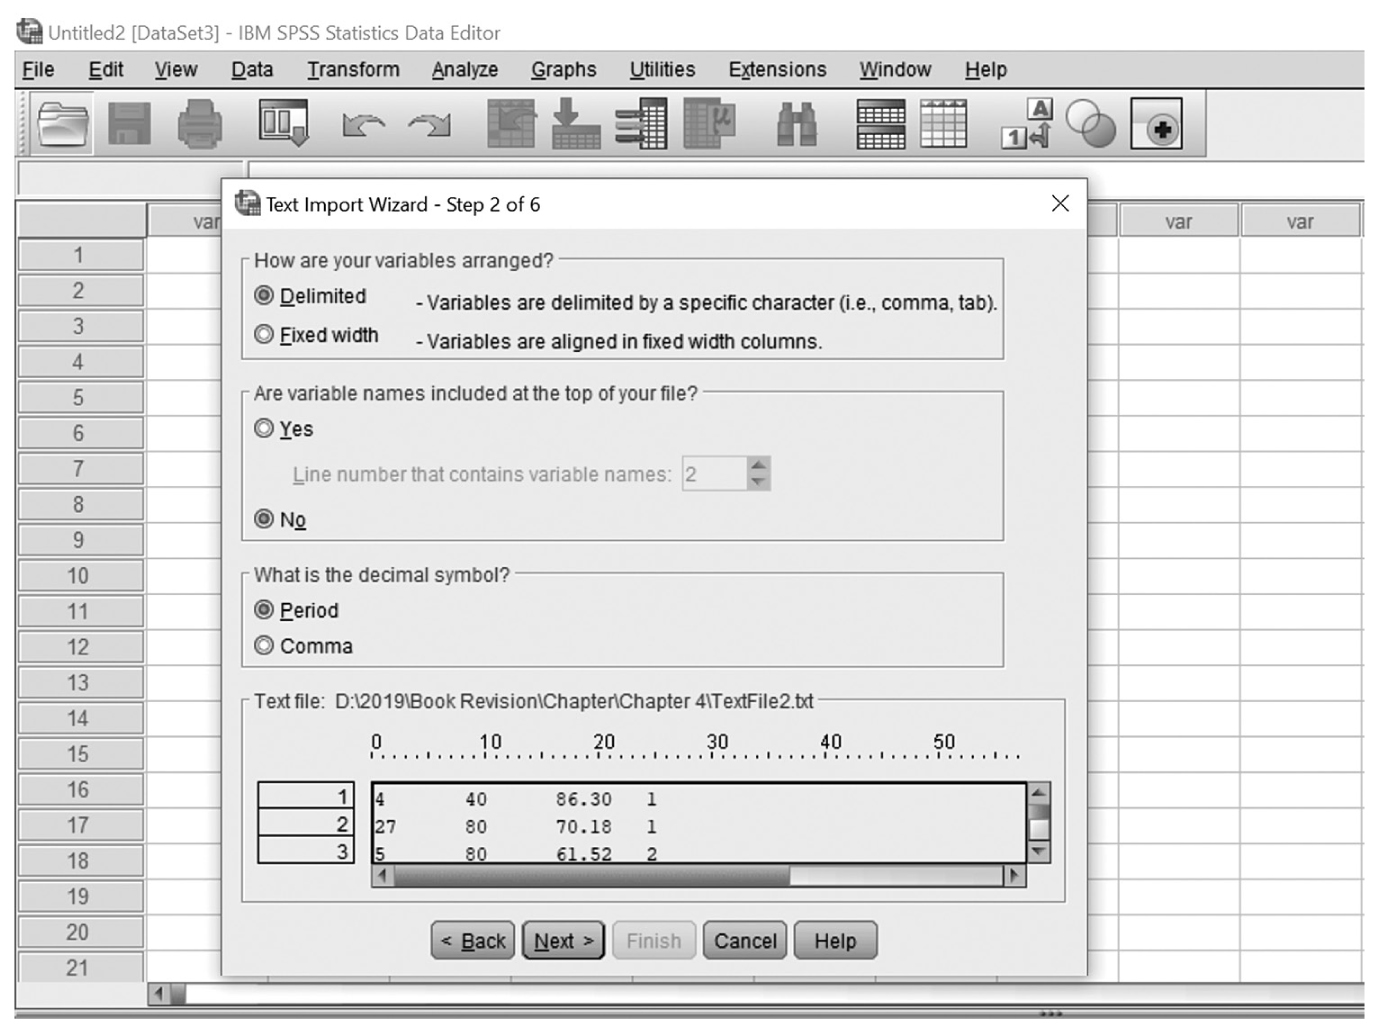
Text import wizard, step 2.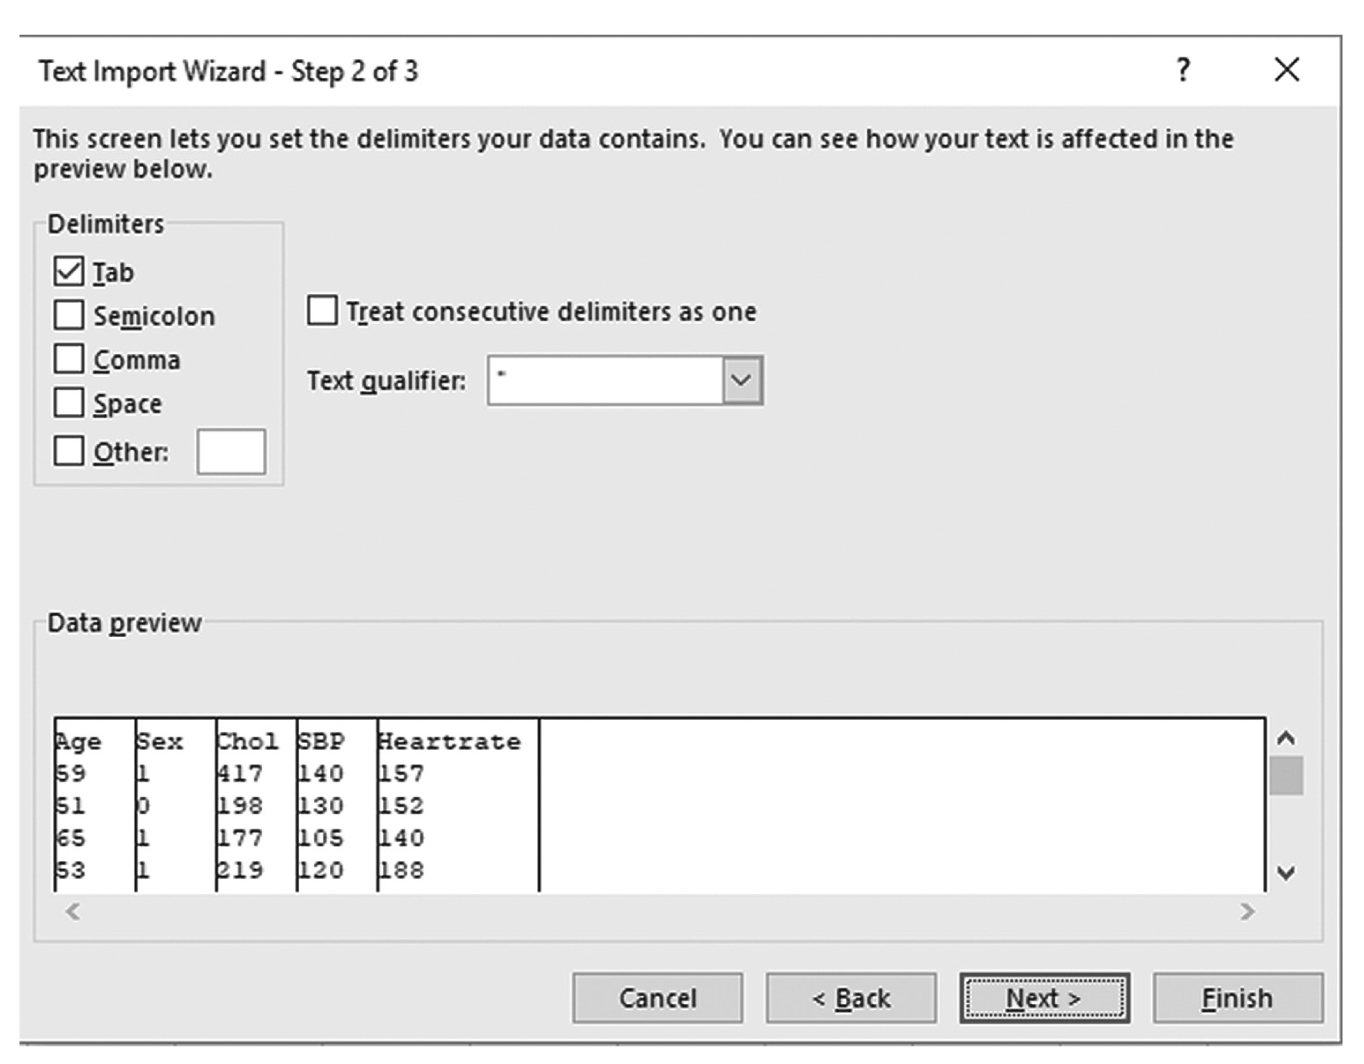
A screenshot of a window that displays the second of the three steps of the Text import wizard of an Excel file.
Courtesy of Microsoft Excel © Microsoft 2020.
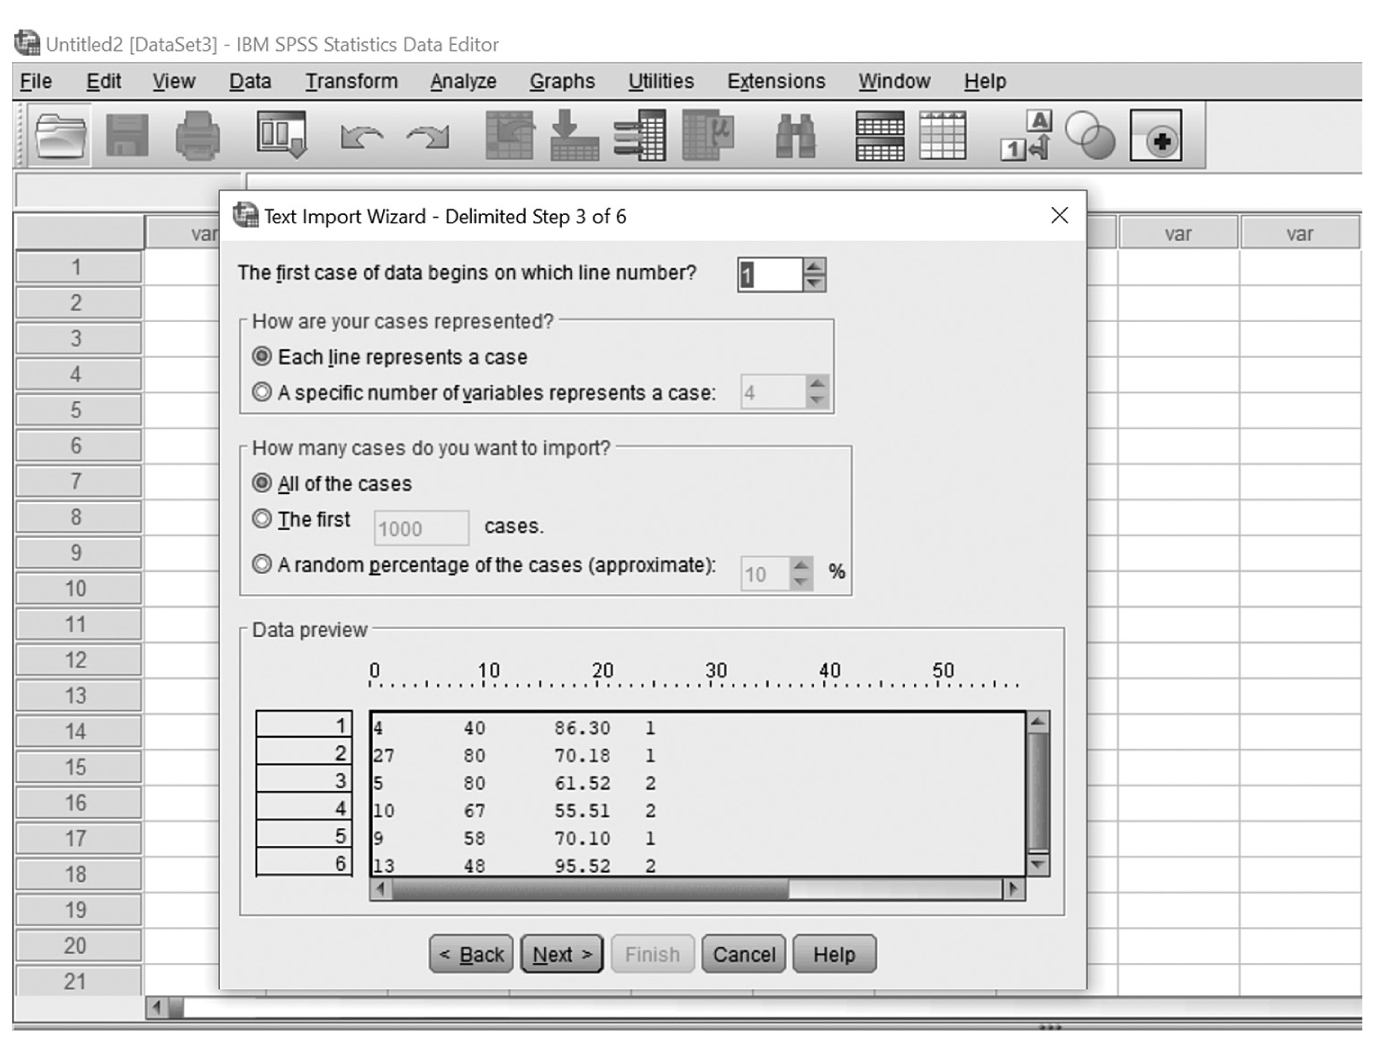
Text import wizard, step 3.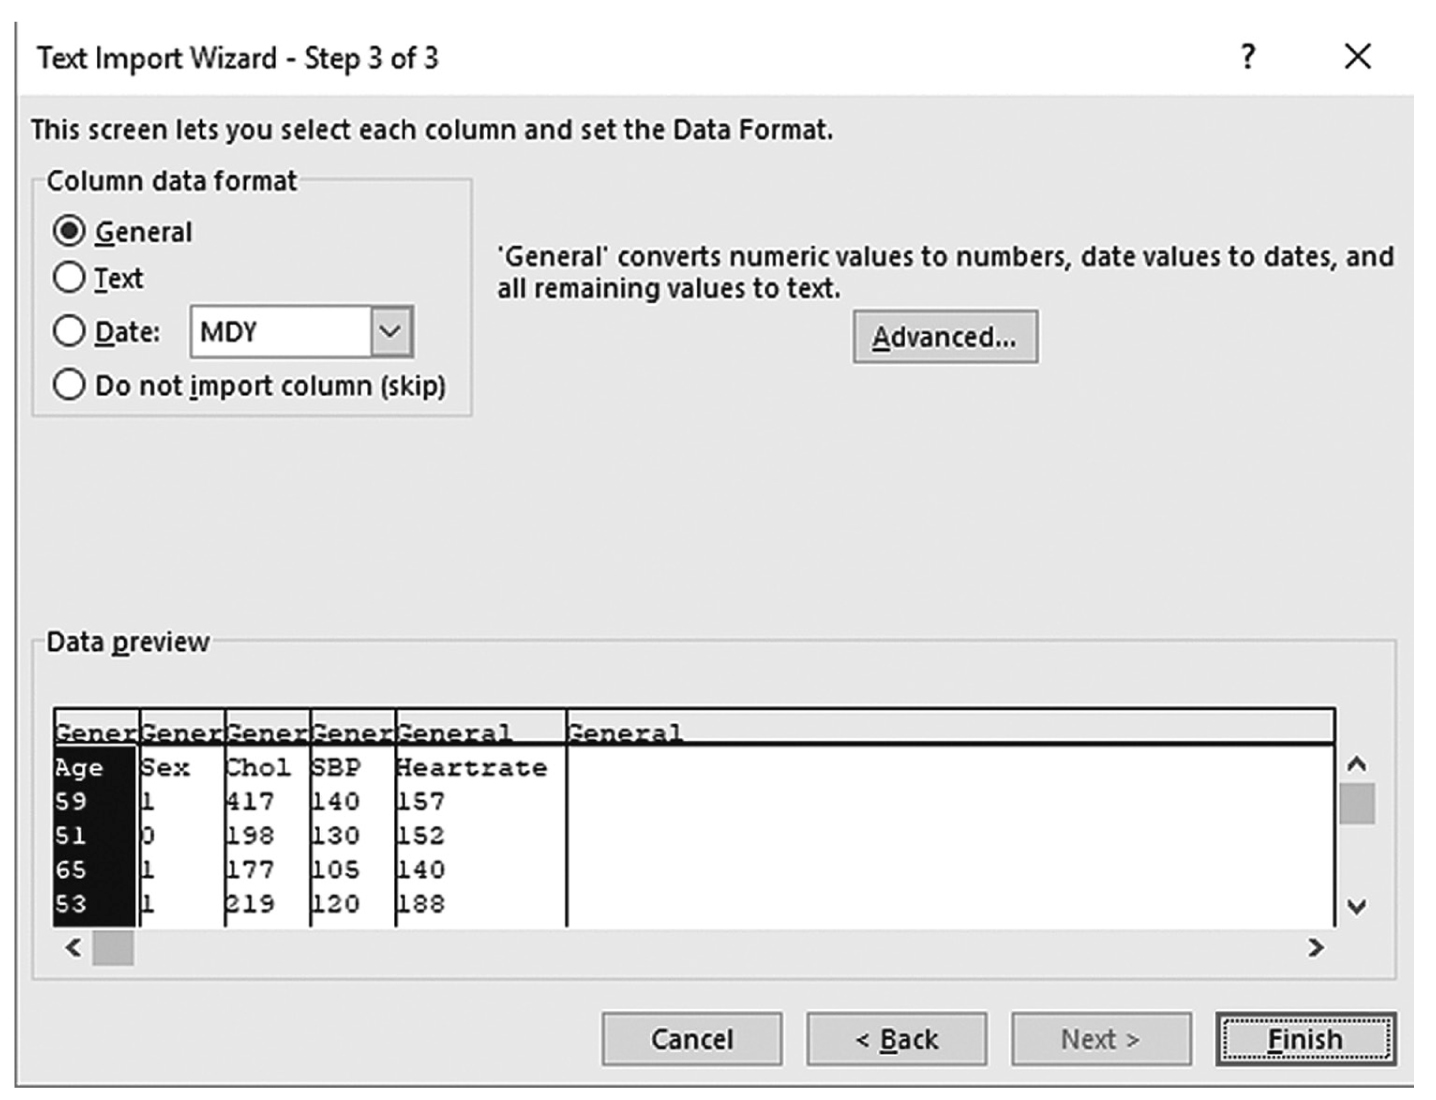
A screenshot of a window that displays the third of the three steps of the Text import wizard of an Excel file.
Courtesy of Microsoft Excel © Microsoft 2020.
Without special changes, click “Next.”
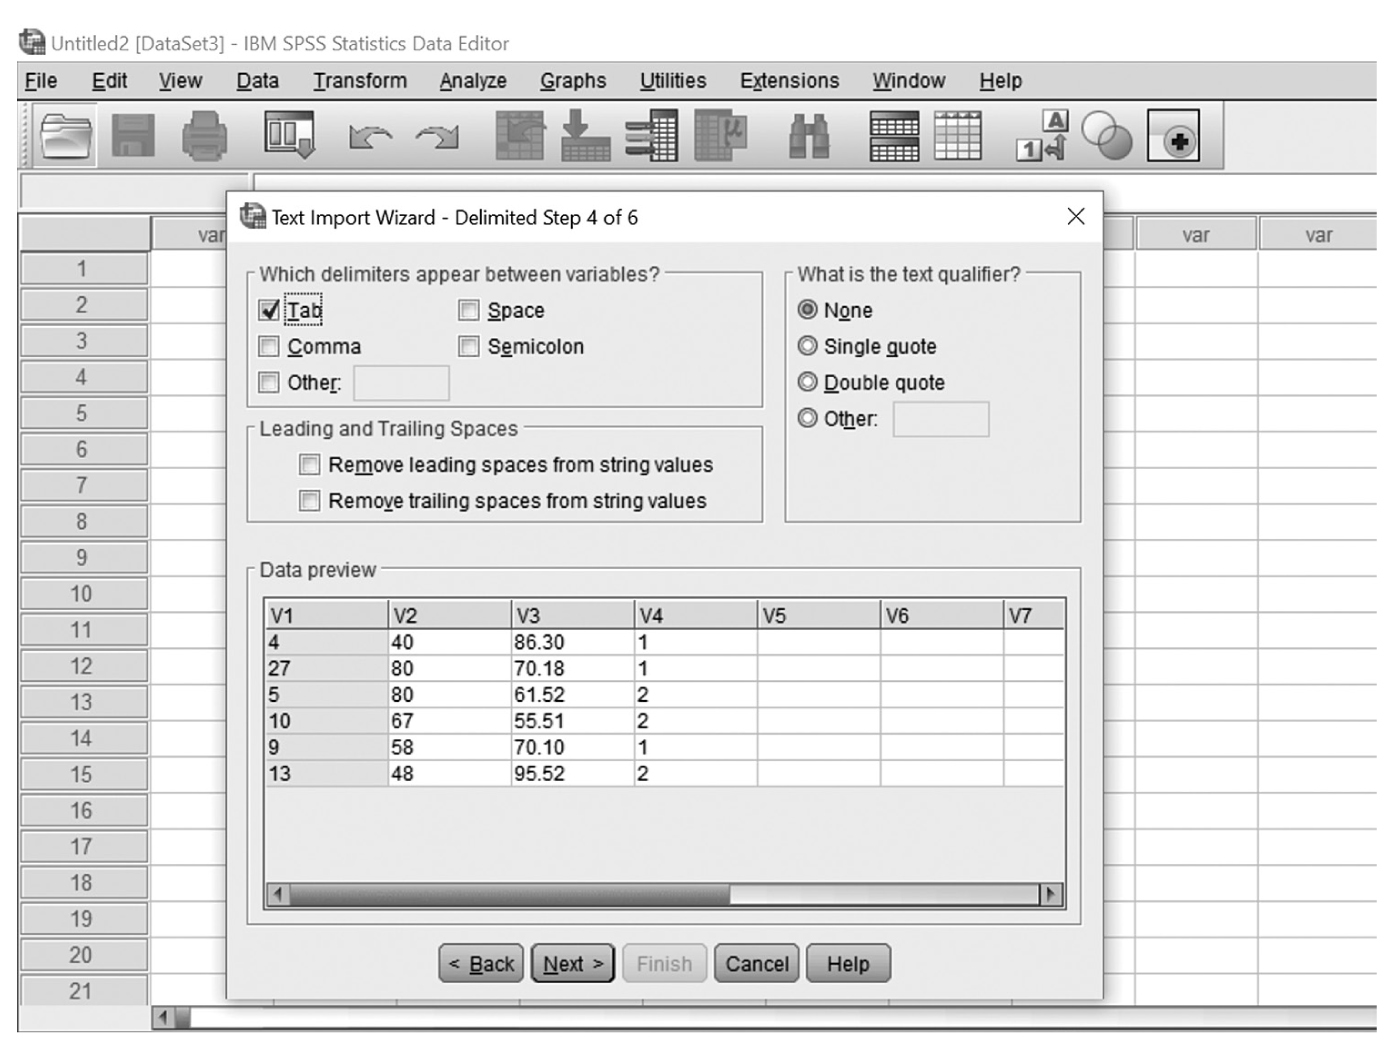
This text file contains the data values separated by Tabs, so leave all options in default mode (i.e., delimited checked) and click “Next.”
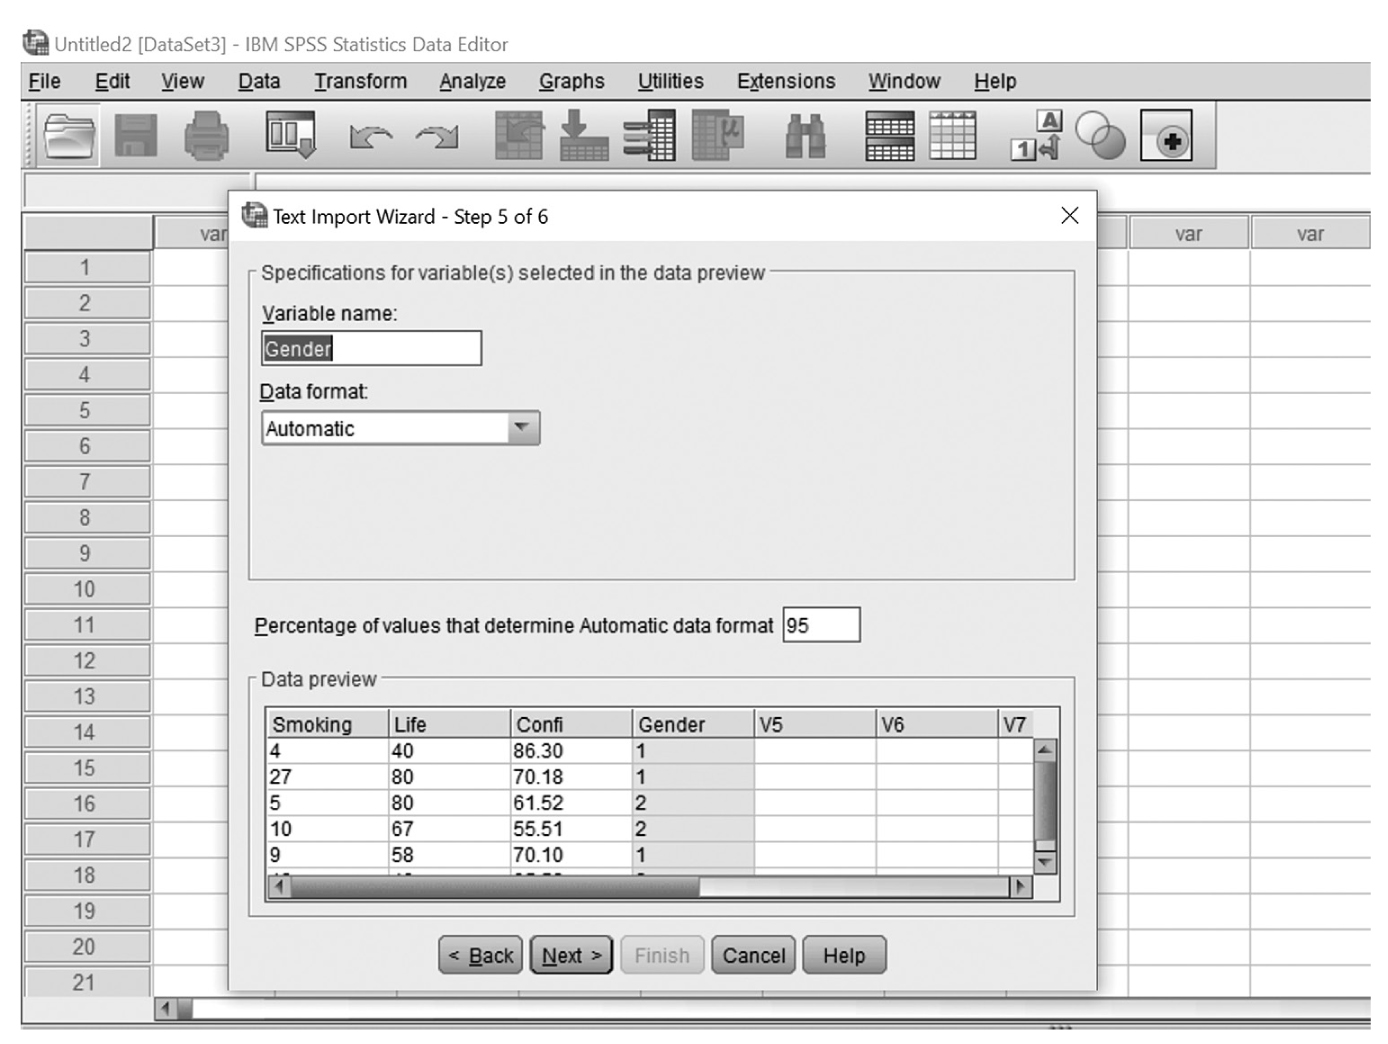
Our data display shows the delimiters that our data contains. Because data look the way they should, click “Next.”
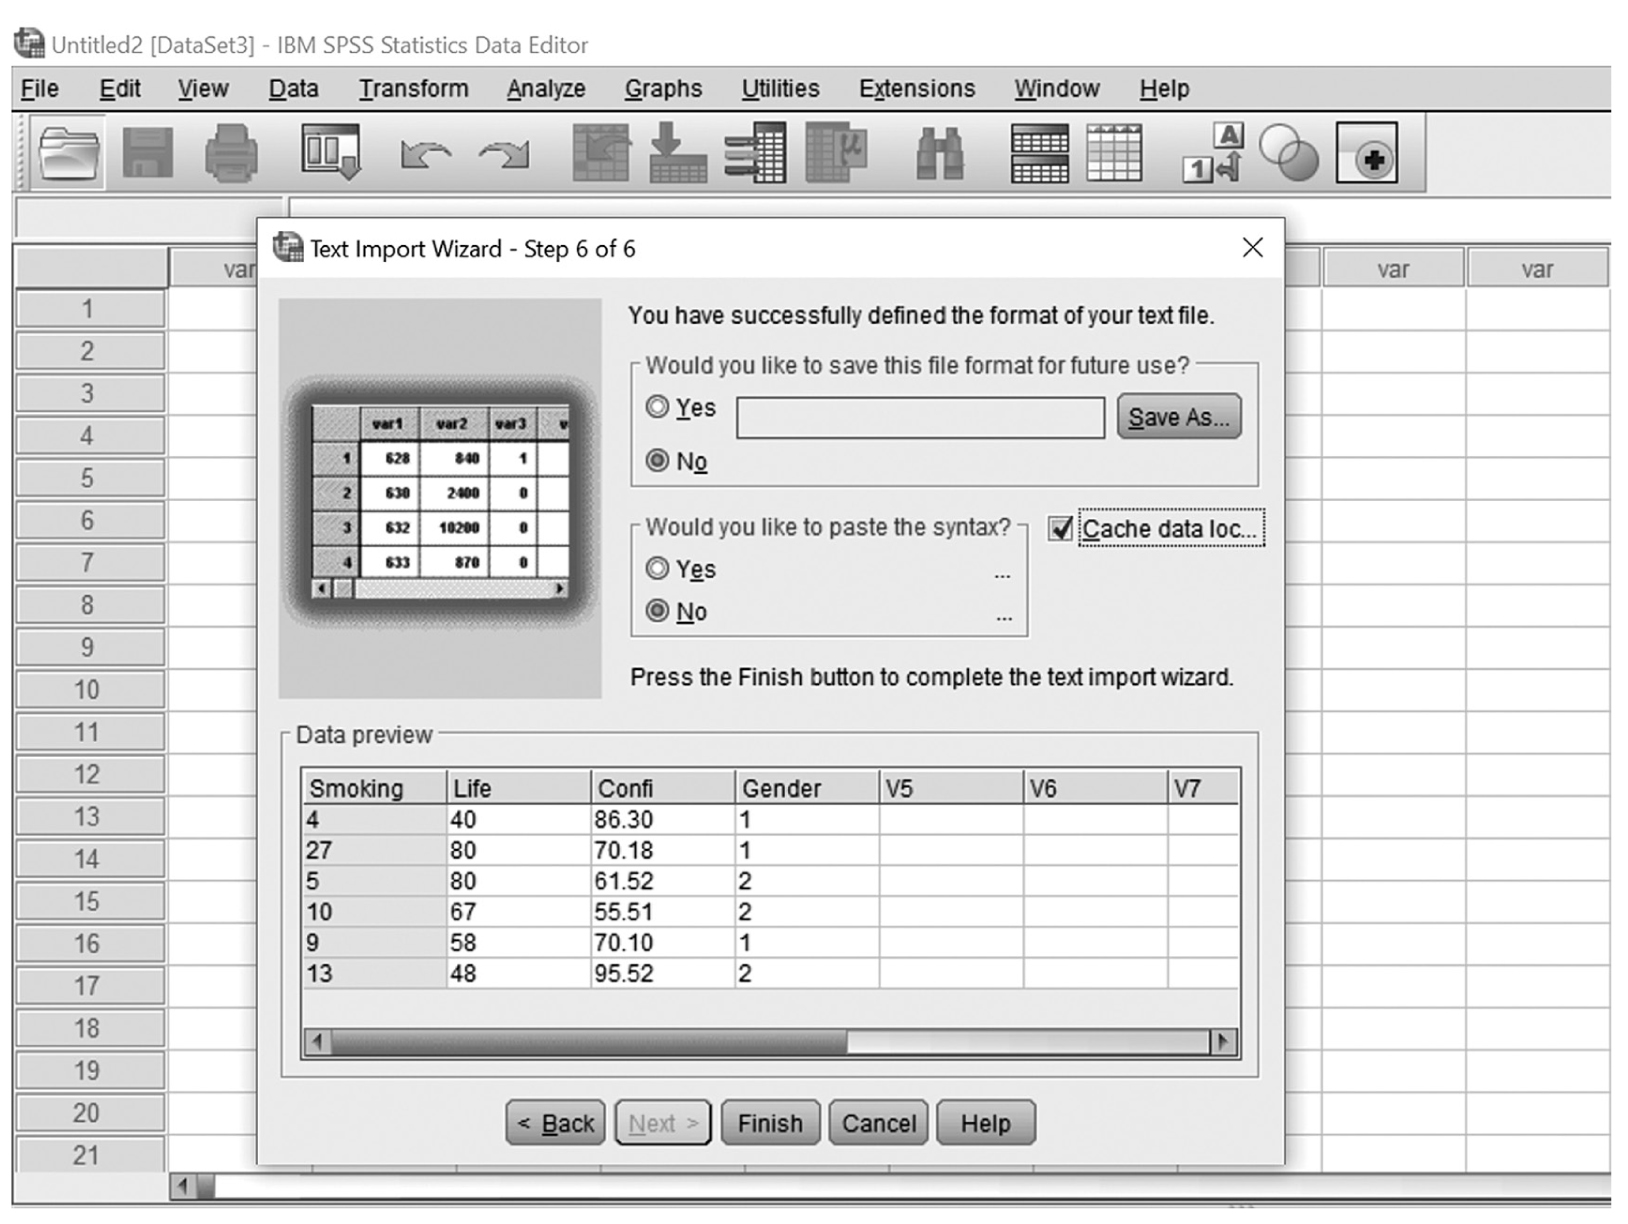
Again, our column data format looks the way it should, so click “Finish.” You have now successfully imported a text file into Excel.
Importing a CSV file into Excel is easier than importing a text file. Assume that the same data file was saved in CSV format. To import a CSV file, go to File > Open > Data. In a new window, as presented in Figure 4-8, change “Files of Type” from All Excel Files to All Files once you locate where the file was saved. Then, select CSVFile.csv and click “Open” in order to open the file, as we did with the text file.
Excel provides many formatting tools to make the presentation of cell values look better and easier to read. For example, if you type “Number of Medications Administered,” it will be too long to fit into a cell. Placing the mouse pointer on the thin line between columns and double-clicking would automatically adjust the column to fit the text in the cell. In another example, assume that a nurse needs to enter the price of medications, but typing a numeric value would not contain the dollar sign with no specific format. Select cell range with numeric values in, then click the small arrow next to the dollar sign, as seen in Figure 4-12, and select “English (United States).” This will show numeric values in a desired format (Figure 4-13).
Changing number format.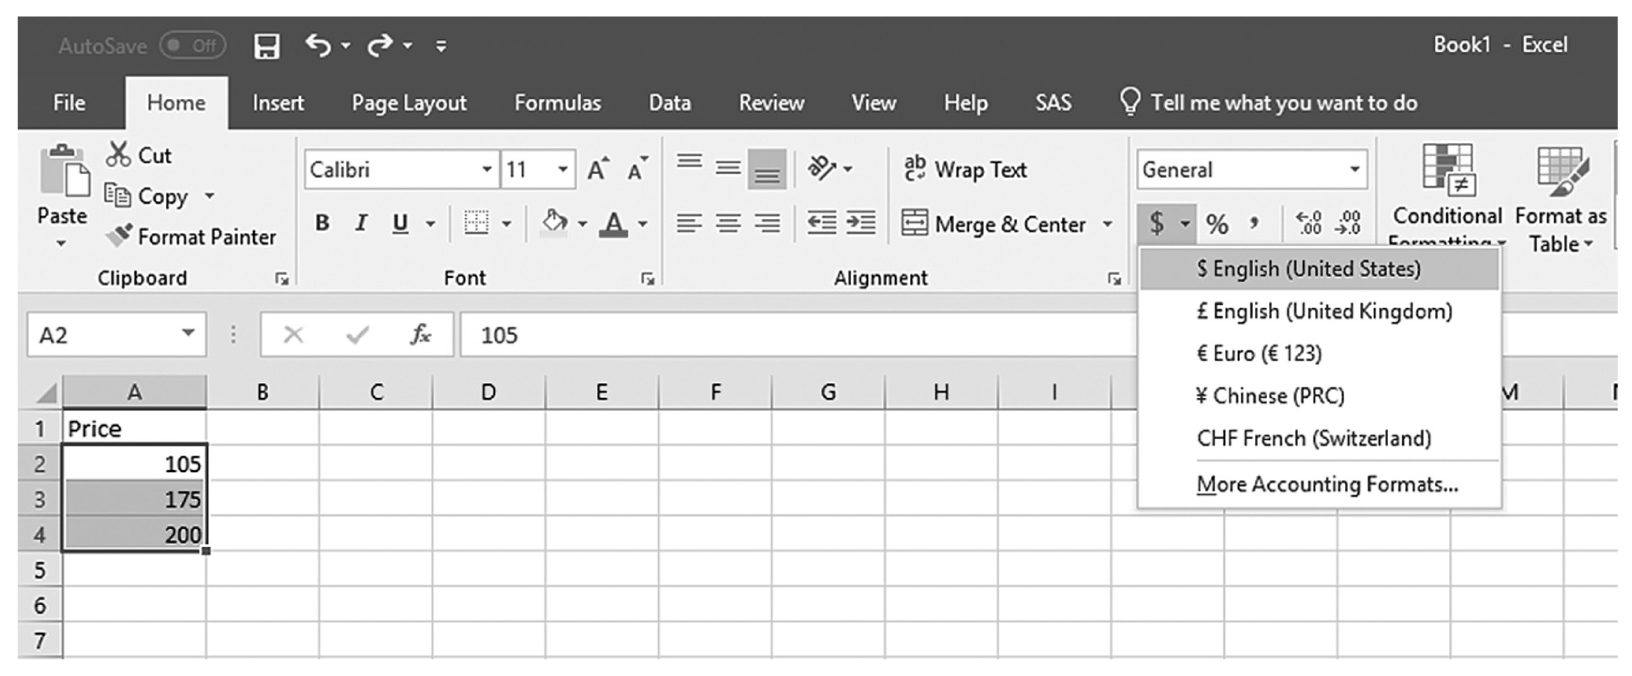
A screenshot of an Excel worksheet displays the different currency formats.
Courtesy of Microsoft Excel © Microsoft 2020.
Result of changing number format.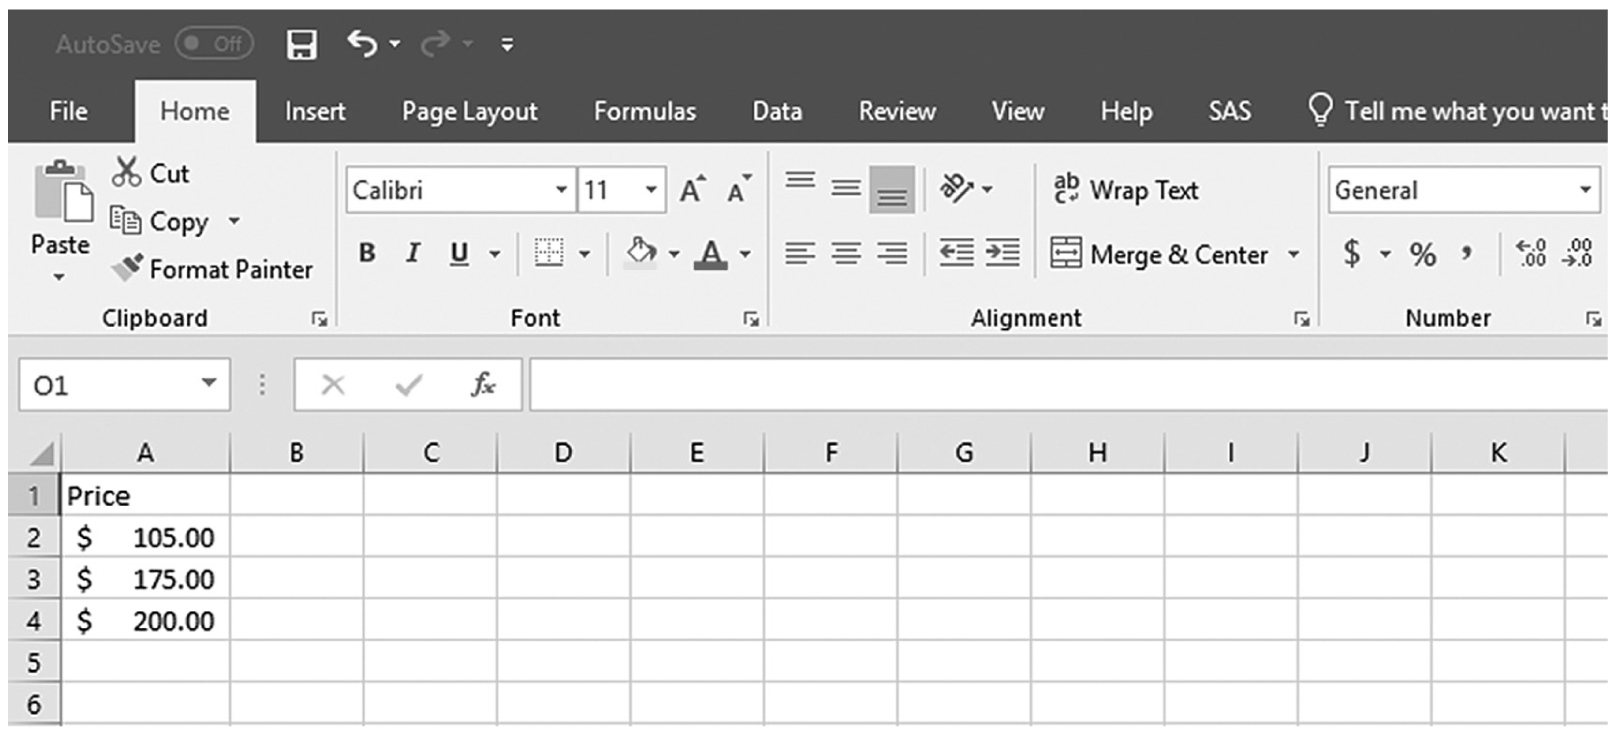
A screenshot of an Excel worksheet shows numerical data with the dollar currency and two decimal places. The data in the first four rows of Column A are as follows: Price; $ 105.00; $ 175.00; $ 200.00.
Courtesy of Microsoft Excel © Microsoft 2020.
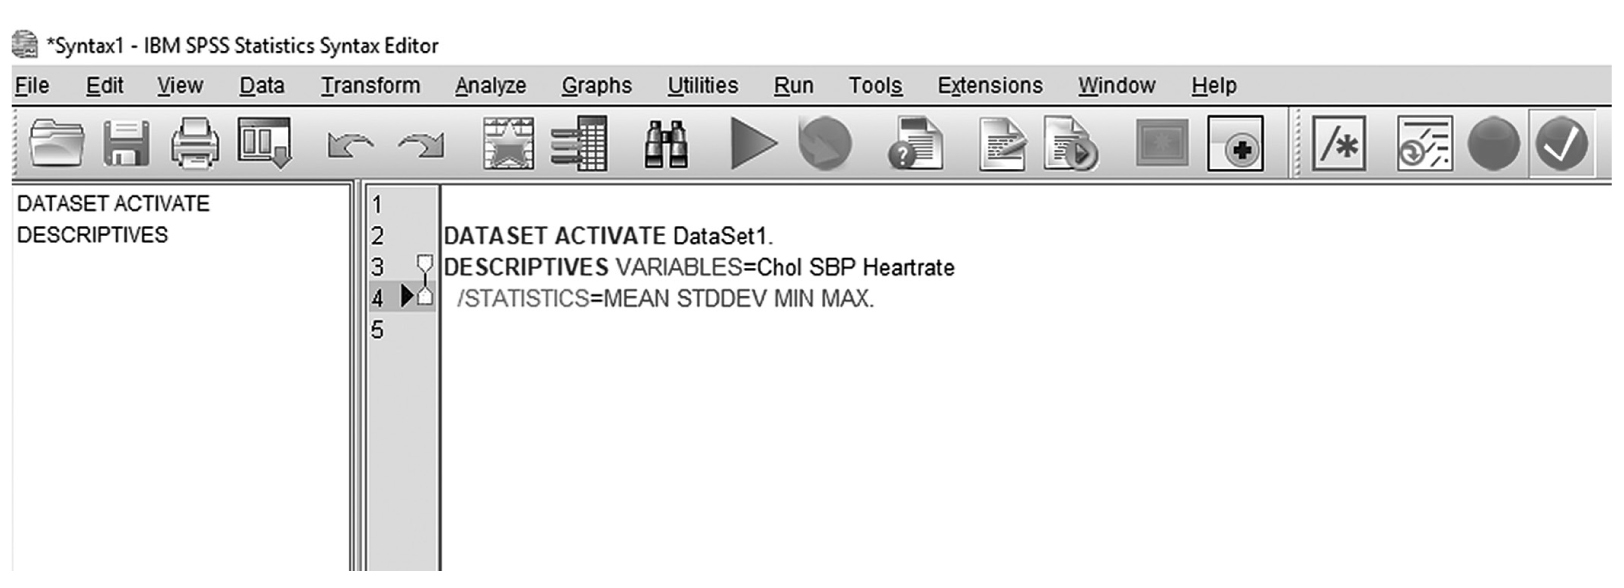
Excel provides numerous formulas and functions that allow you to quickly make specific calculations. Although we cannot cover every formula and function, let us learn how to perform basic calculations. For example, an emergency department (ED) nurse might be interested in how many patient visits the ED had this past week. With the data shown in Figure 4-14, click into cell B9 and type the equal (=) sign (Note: Formulas and functions always begin with an equal sign), followed by “B2+B3+B4+B5+B6+B7+B8”, as we need to add patients over the past 7 days. You should get “60” as a resulting value in cell B9 once you hit Enter (Figure 4-15). Note that you can also get the same value by clicking the “∑Autosum” function on the top right corner of the worksheet with cell B9 selected (Figure 4-16). A variety of functions are available in the “Formulas” Tab, and clicking “Insert Functions” on the top-left corner will open a new window, as shown in Figure 4-17. You can select a function from the list that will suit your need; we will cover selected functions in later chapters.
Using formulas to calculate values.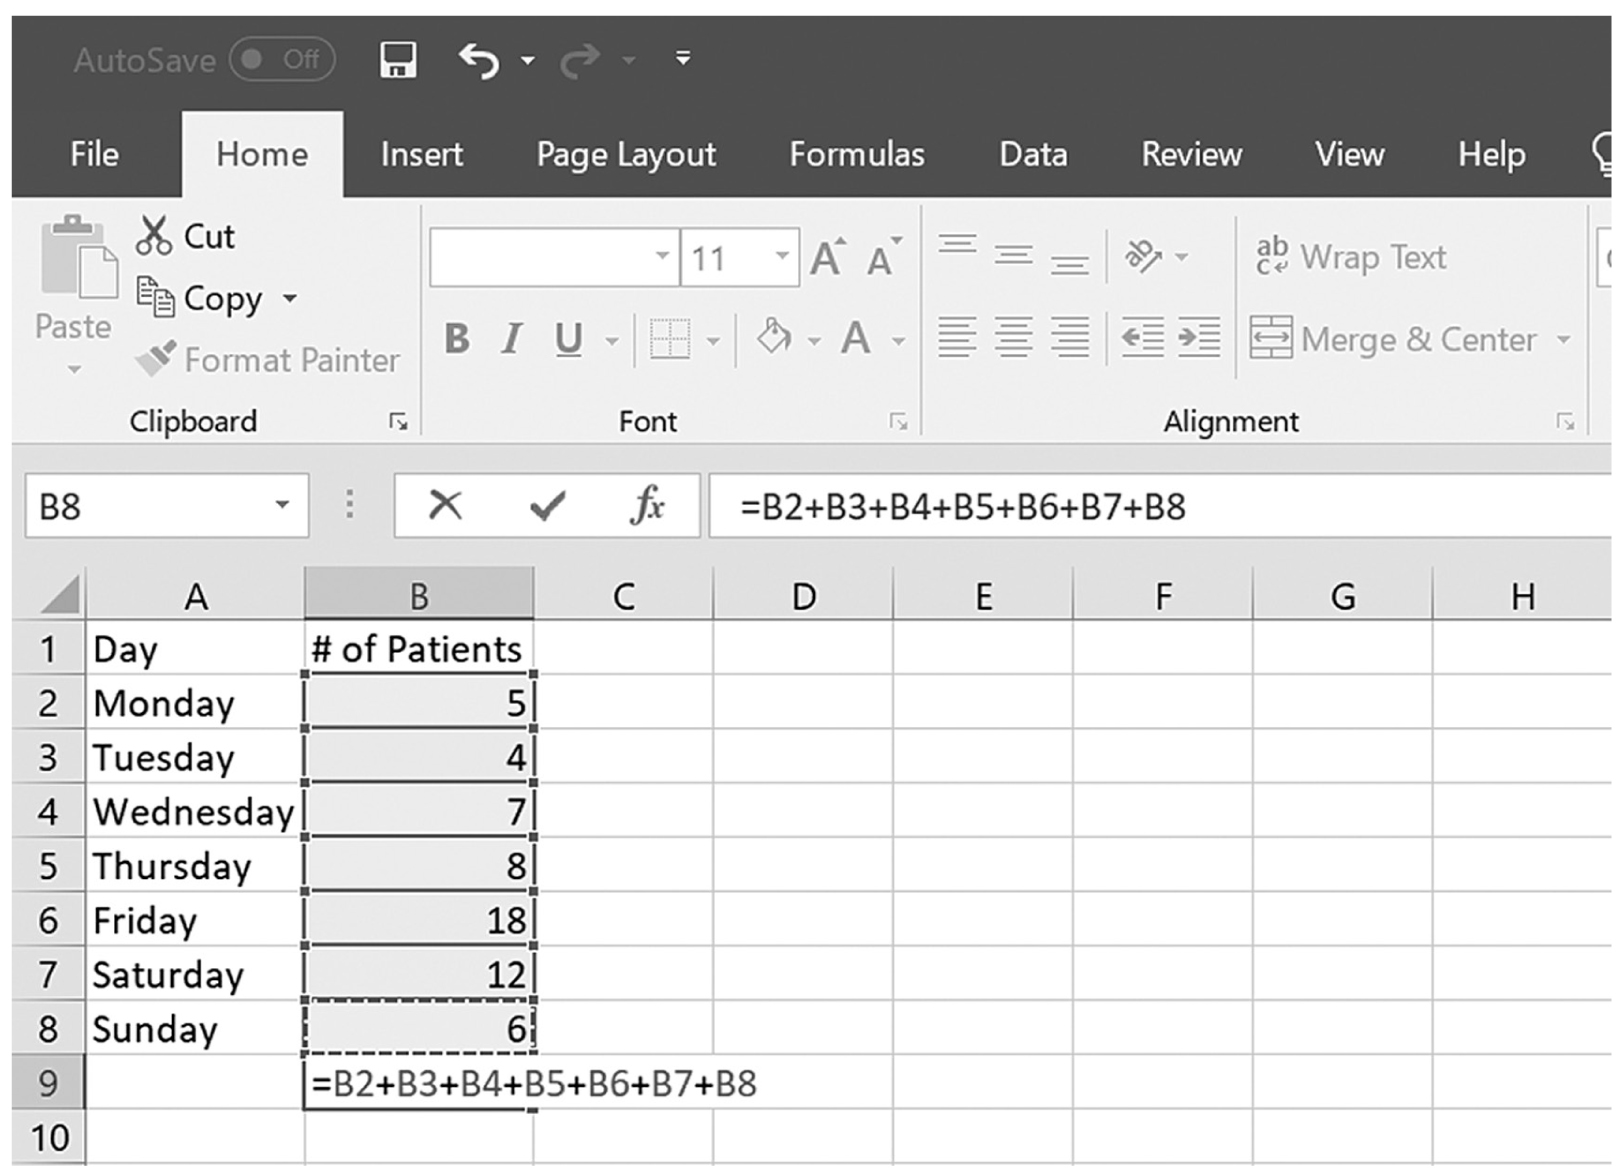
A screenshot of an Excel worksheet shows the addition formula of a random numerical list.
Courtesy of Microsoft Excel © Microsoft 2020.
Result of using formulas to calculate values.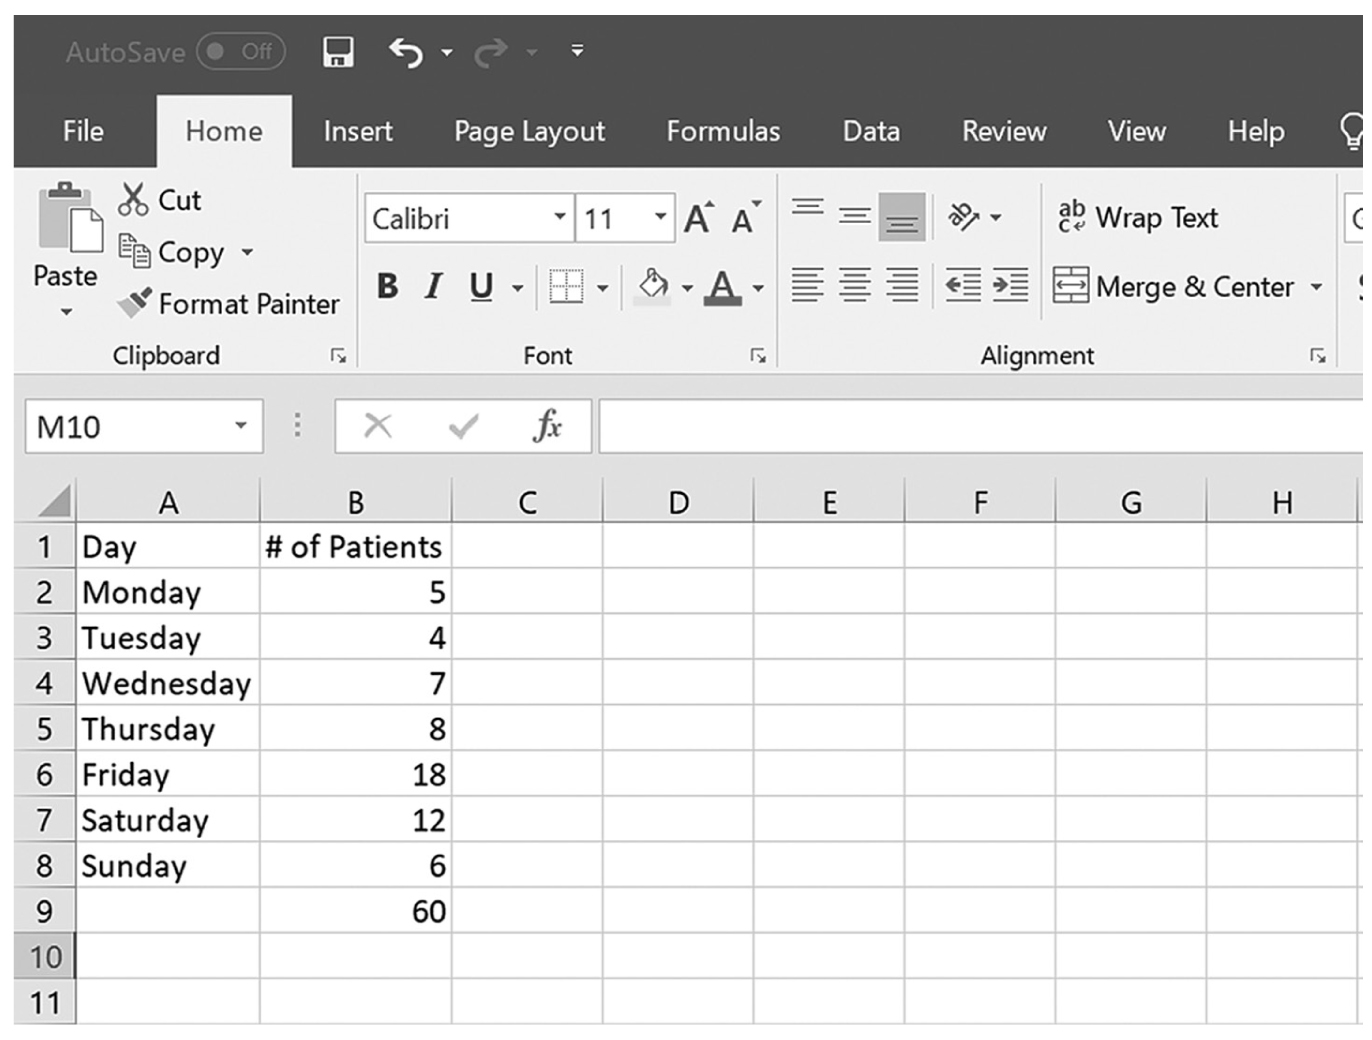
A screenshot of an Excel worksheet shows the added value of a random numerical list.
Courtesy of Microsoft Excel © Microsoft 2020.
Using the Autosum function.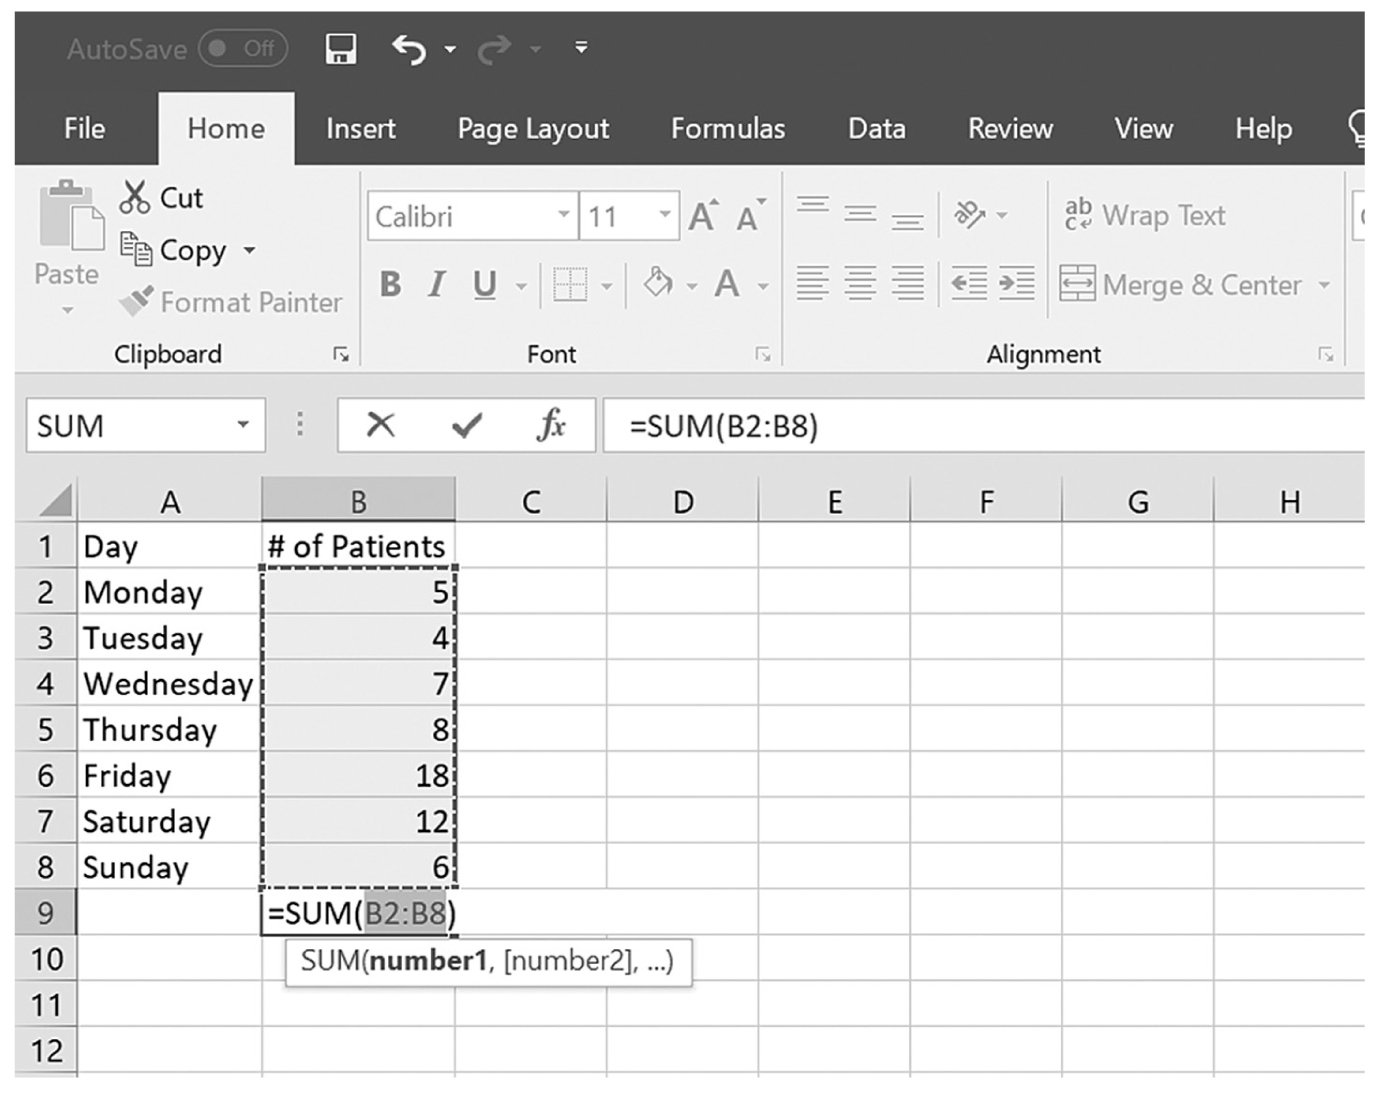
A screenshot of an Excel worksheet displays the Autosum function.
Courtesy of Microsoft Excel © Microsoft 2020.
Inserting different functions and formulas.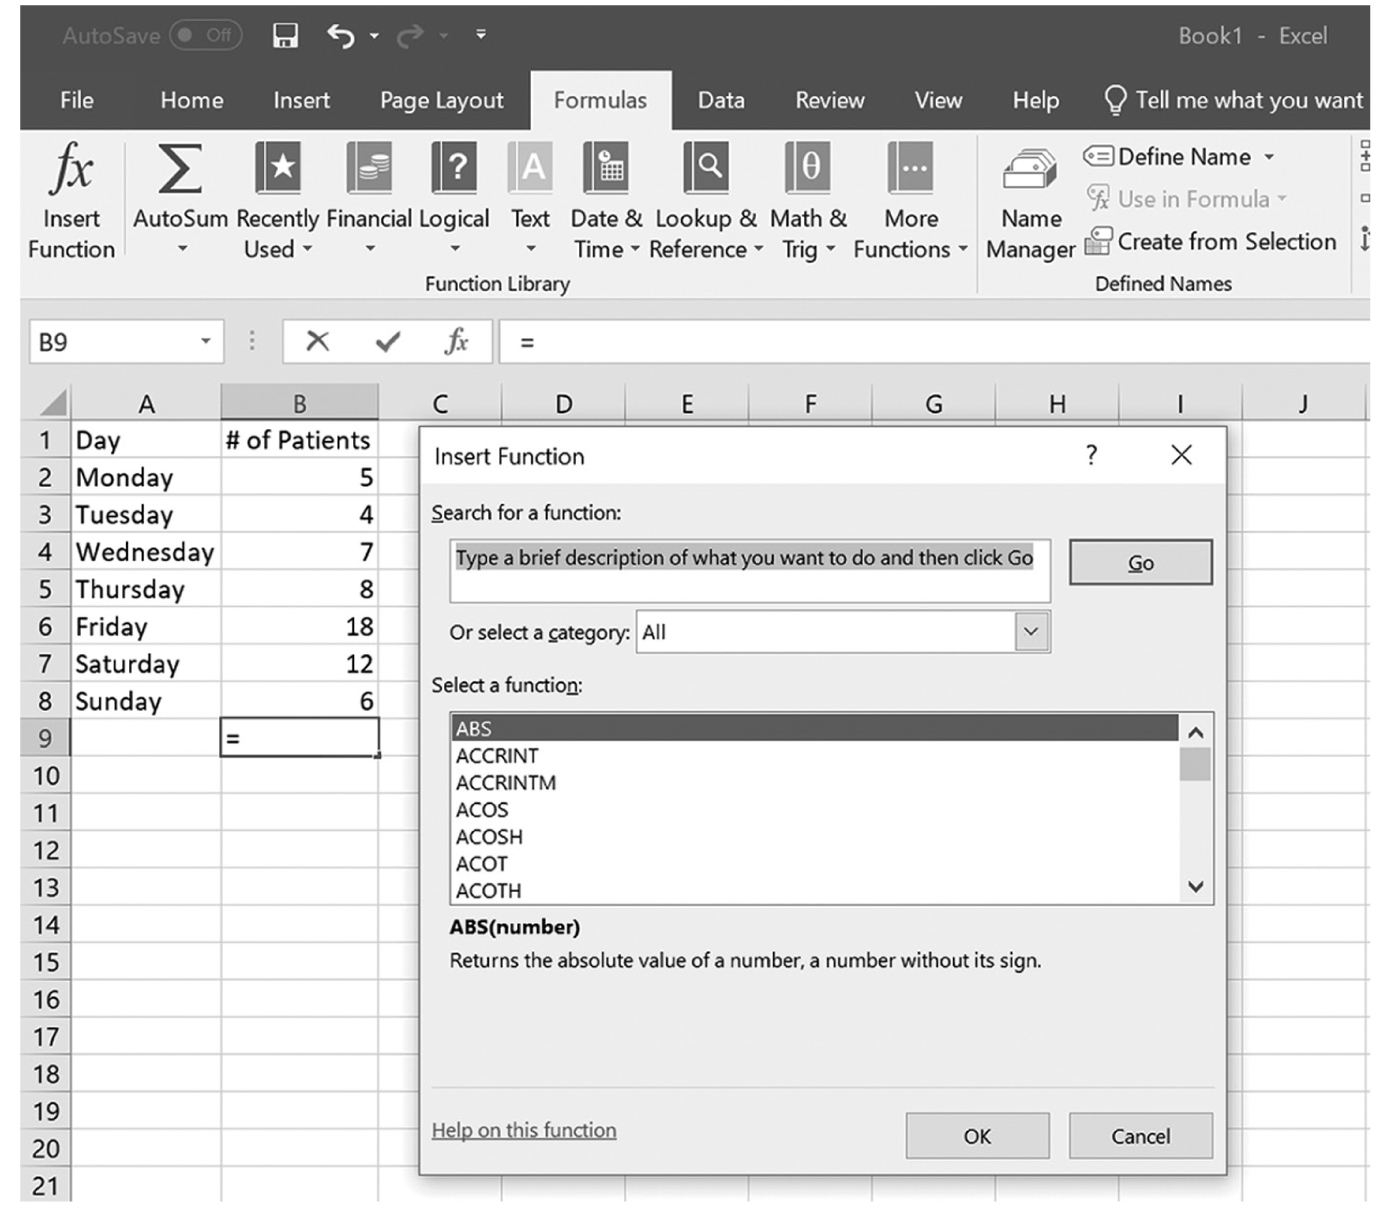
A screenshot of an Excel worksheet depicts the insertion of different functions.
Courtesy of Microsoft Excel © Microsoft 2020.
Additional worksheets can be added by clicking the new sheet button next to “sheet1” (Figure 4-18), and multiple worksheets can be useful to organize a large amount of data. You can rename a worksheet by doing the following: (1) double-click on the worksheet name to be renamed, or right-click on the worksheet name to be renamed and choose “Rename” from the menu; (2) type the desired name for the worksheet to be renamed; and (3) press Enter. To delete a worksheet, you will need to click on the worksheet to remove and then choose Home→Delete→Delete Sheet on the Ribbon or right-click Tab and then choose Delete from its shortcut menu.
Adding worksheets.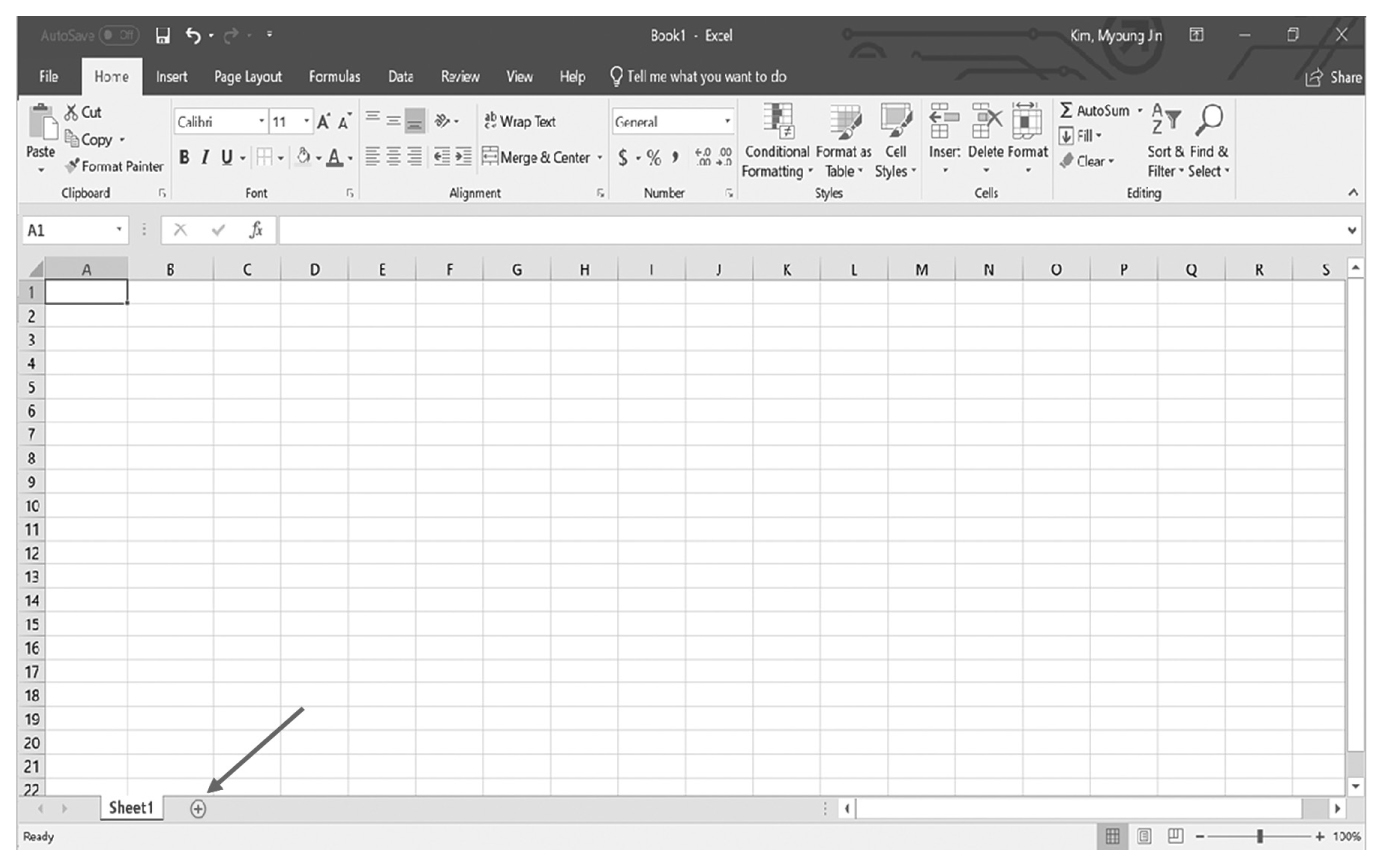
A screenshot of an Excel worksheet shows the name of the current sheet, Sheet 1; it is followed by a tab with a plus sign indicating addition of a worksheet.
Courtesy of Microsoft Excel © Microsoft 2020.