section name header
Figure
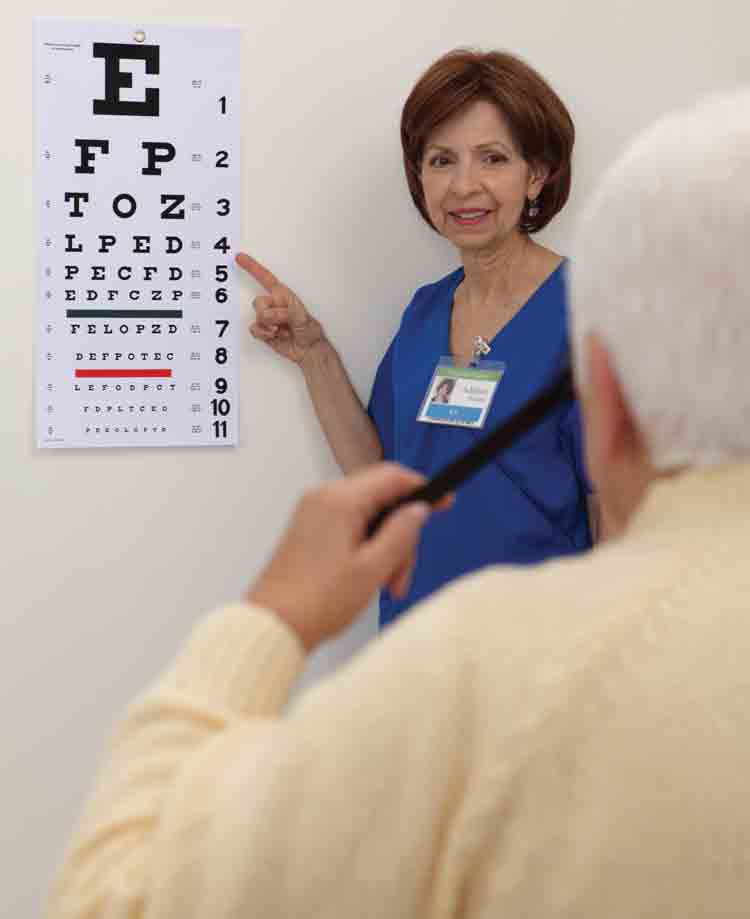
6. Testing Visual Acuity with a Snellen Chart