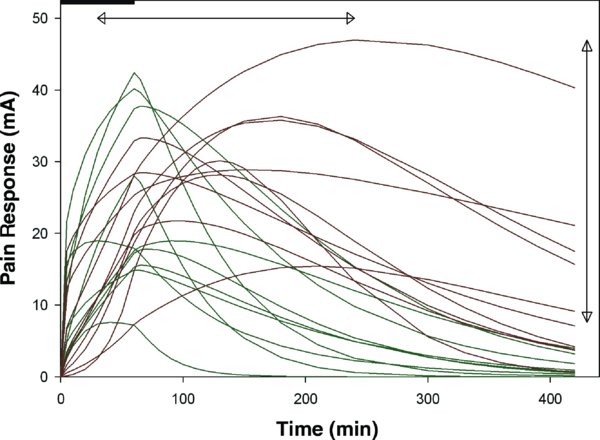
An intravenous infusion of 0.13 mg/kg was given to 10 healthy male (green lines) and female (red lines) volunteers. Their pain tolerance to a transcutaneous electrical stimulation (y-axis) was measured over a 7-hour period. The variability in magnitude of peak analgesia and time to peak effect are made visible by the vertical and horizontal arrowed lines. The black bar indicates the 1-hour morphine infusion.