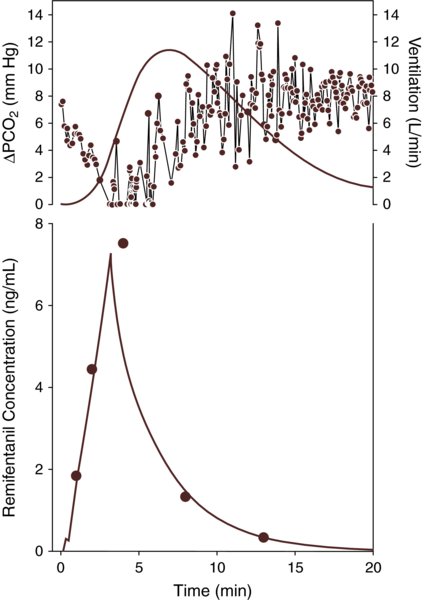
Note the absence of a delay between the remifentanil plasma concentration and ventilation and the short delay between the plasma concentration and the end-tidal PCO2. Top The increase in end-tidal PCO2 ( PCO2, green line), the measured inspired ventilation (grey dots; each dot is one breath). Bottom. The measured remifentanil plasma concentration (red dots) and the pharmacokinetic data fit (red line). The black bar indicates the infusion period.