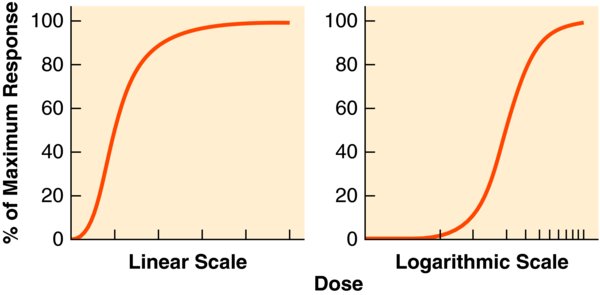
In the left panel, the response data are plotted against the dose data on a linear scale. In the right panel, the same response data are plotted against the dose data on a logarithmic scale, yielding a sigmoid dose–response curve that is linear between 20% and 80% of the maximal effect.