Image
Selection of Antihypertensive Drugs
Selection of antihypertensive drugs
- Select the drug individually.
- The factors influencing the selection include
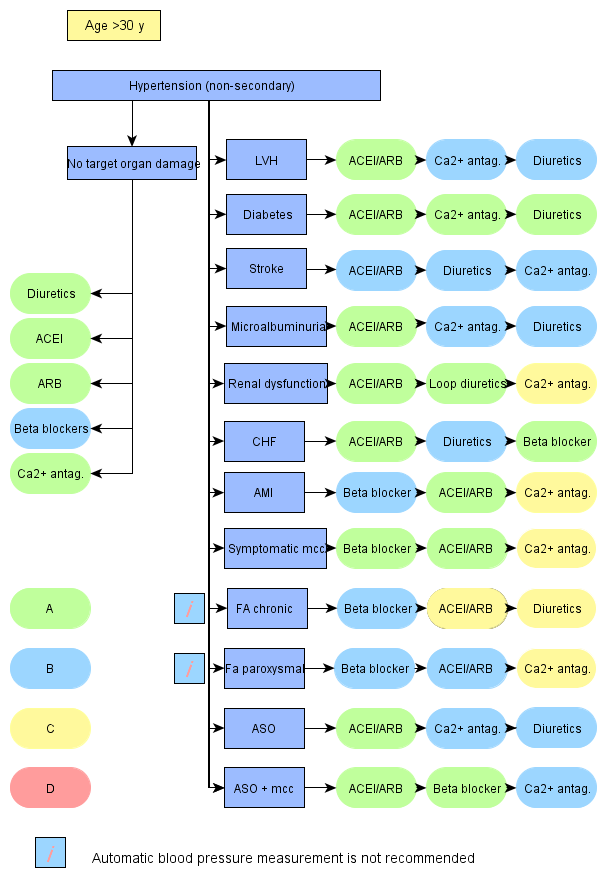
- The algorithm contains a suggestion of the selection of antihypertensive drugs in association with different comorbidities and situations
- Lääkkeiden järjestys rivillä on niiden suosituimmuusjärjestys.
Use of the algorithm with electronic health records
- Diseases and risk factors found from the electronic health record are indicated with blue colour.
- The drugs used by the patient according to the health record are indicated with blue colour
- Suggestion for the next add-on drug is indicated with green colour
- If the patient has several diseases or risks influencing drug selection, different drugs may be indicated with green colour. Clinical judgment must be used in these cases and select a drug with best ratio of benefits and harms