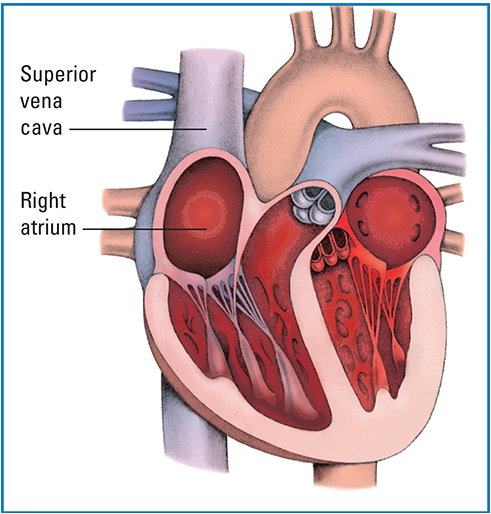
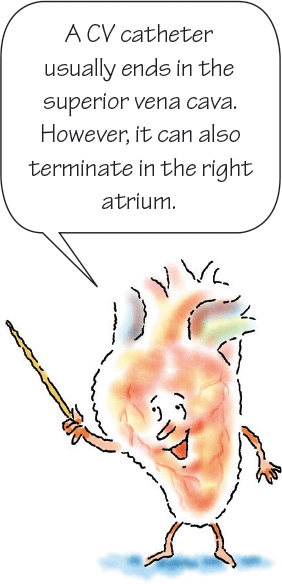
In central venous pressure (CVP) monitoring, the provider or licensed independent provider inserts a catheter through a vein and advances it until its tip lies in or near the right atrium. Because no major valves lie at the junction of the vena cava and right atrium, pressure at end diastole reflects directly back to the catheter. When connected to a transducer or manometer, the catheter measures CVP, a direct reflection of right atrial pressure and an indirect measure of preload of the right ventricle.
What it does
CVP monitoring helps assess cardiac function, evaluate venous return to the heart, and determine the volume status of the body. The central venous (CV) line also provides access to a large vessel for rapid, high-volume fluid administration and enables frequent blood withdrawal for laboratory samples. For patients who are critically ill, especially those in cariogenic shock, CVP is a marker for volume status.
Intermittent or continuous?
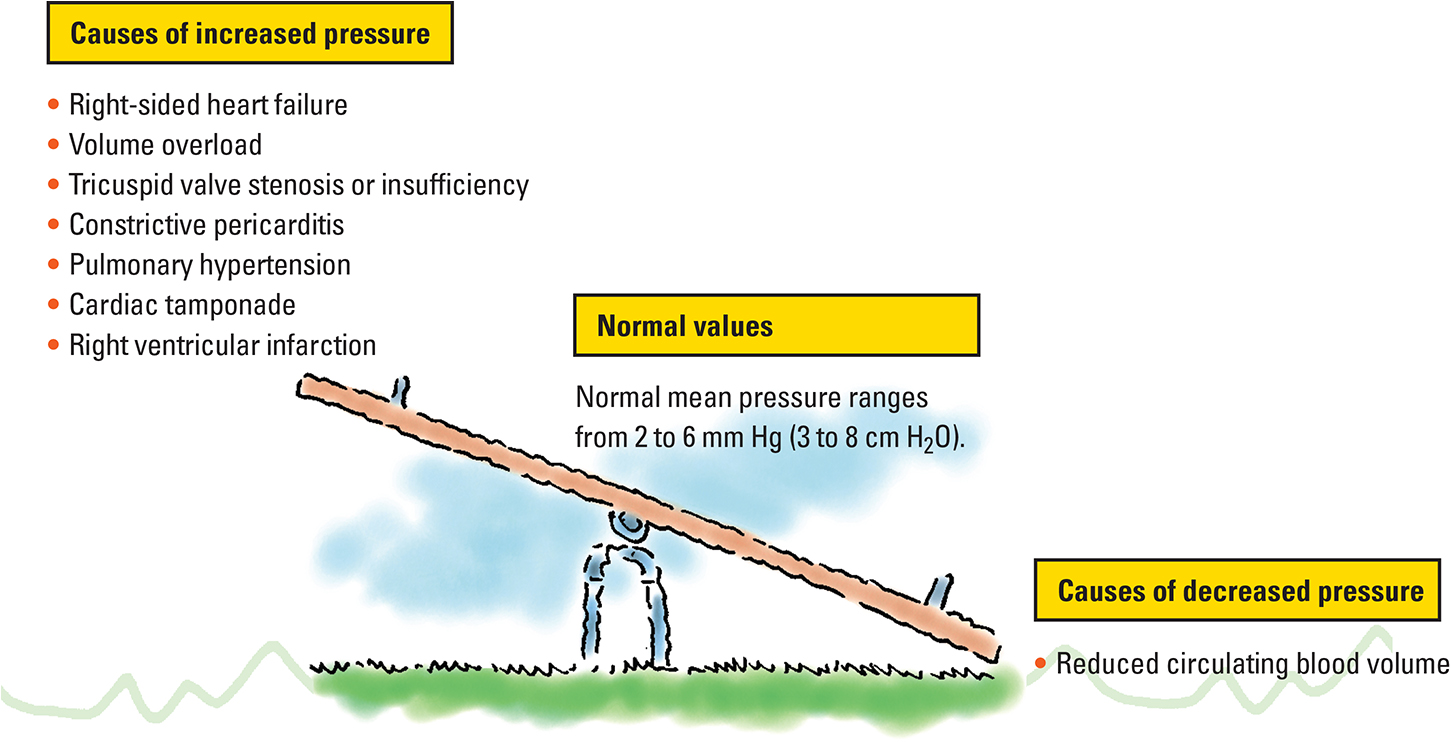
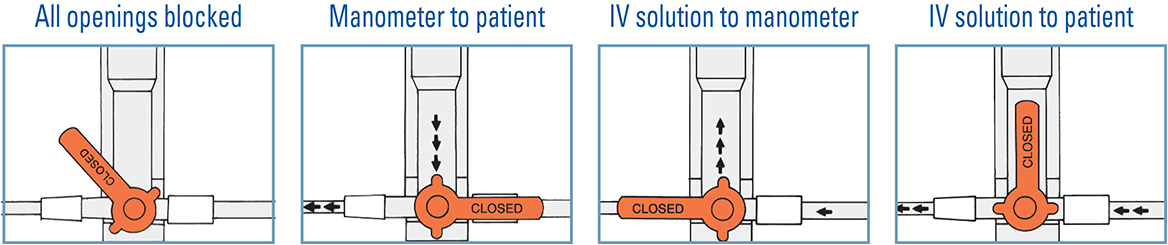
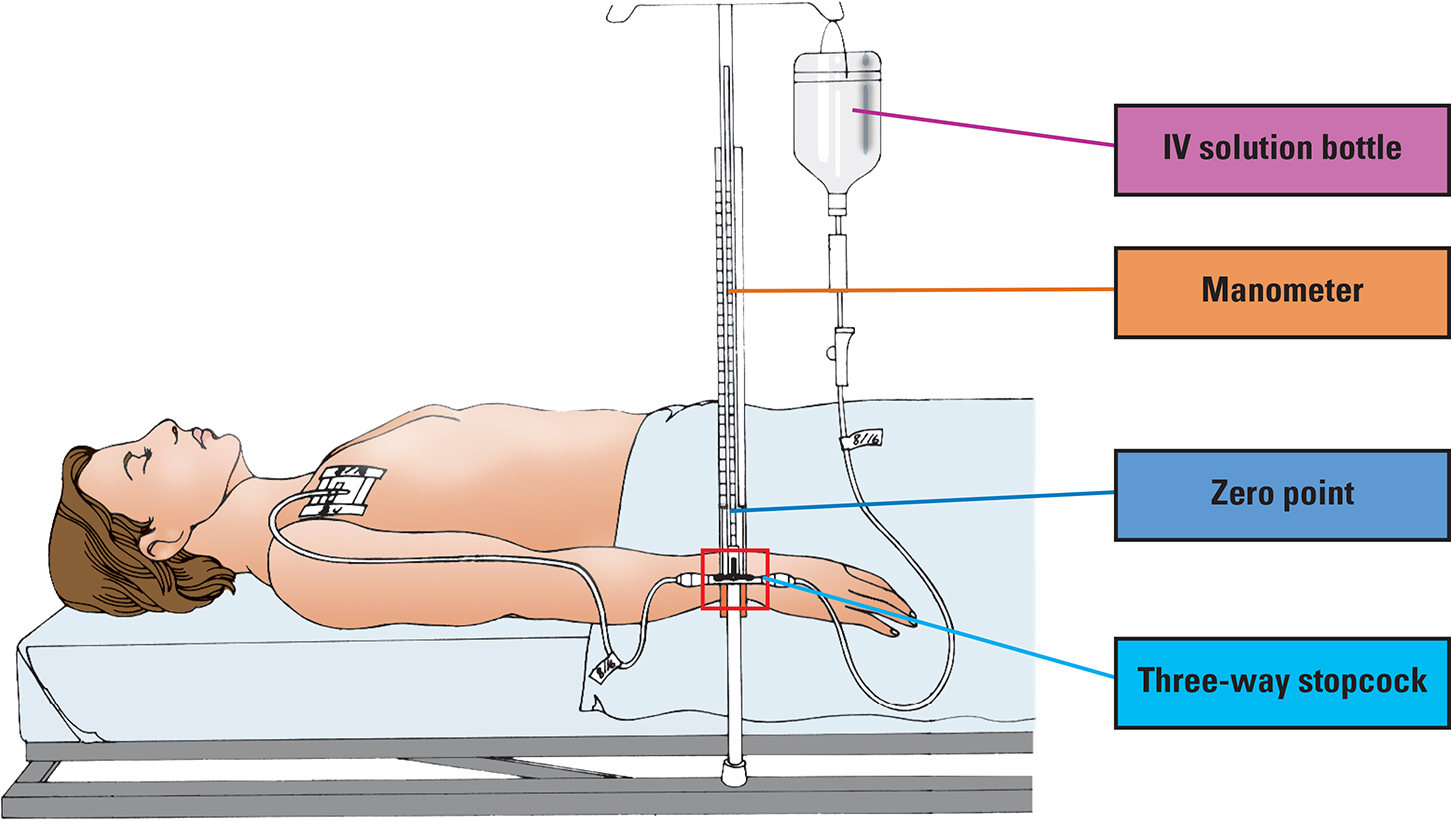
CVP monitoring can be done either intermittently or continuously. Typically, a single lumen CVP line is used for intermittent pressure readings using a disposable plastic water manometer. CVP is recorded in centimeters of water (cm H2O) or millimeters of mercury (mm Hg) read from manometer markings. However, more commonly, a pressure transducer system is used to measure continuous CVP. It is vital to trend the CVP measurements rather than to obtain one single measurement, because the trend gives information about a patient's clinical status.
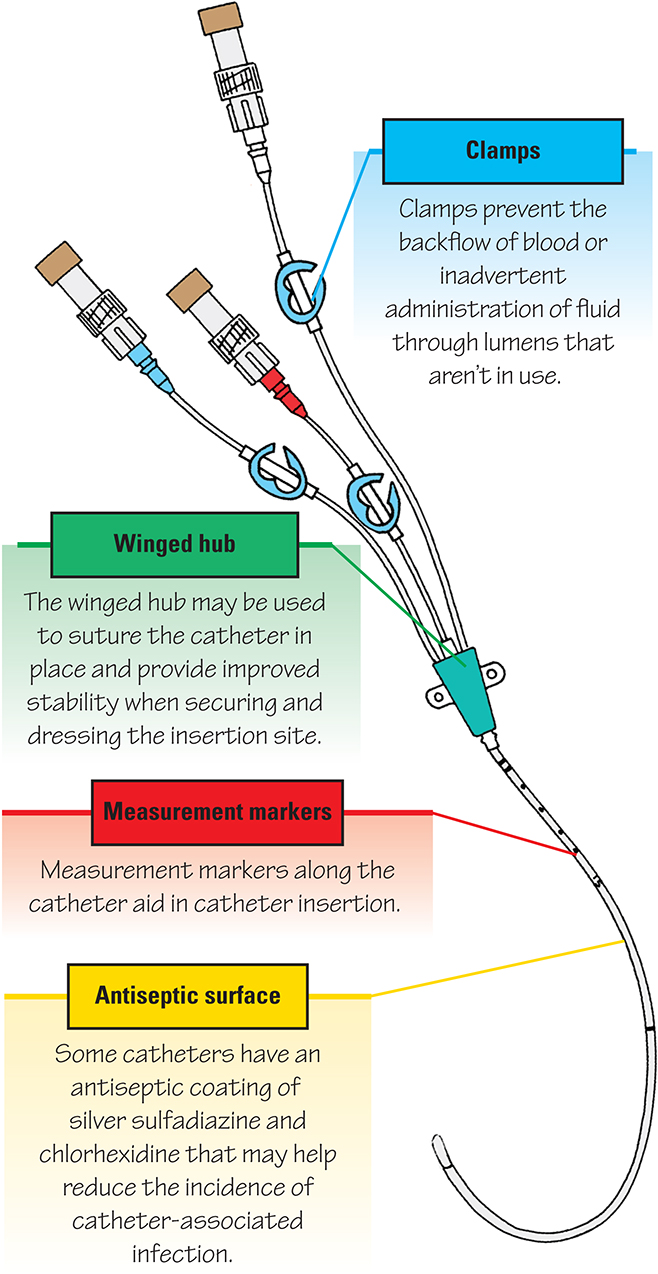
A closer look at a central venous catheter
The below figure provides information about the parts of a CV catheter.
Follow these steps to obtain CVP measurements:
Make sure that the CV line or the proximal lumen of a pulmonary artery catheter is attached to the system. (If the patient has a CV line with multiple lumens, one lumen may be solely dedicated to continuous CVP monitoring and the other lumens may be used for fluid administration.)
Set up a pressure transducer system. Connect the nonpliable pressure tubing from the CVP catheter hub to the transducer. Then connect the flush solution container to a flush device.
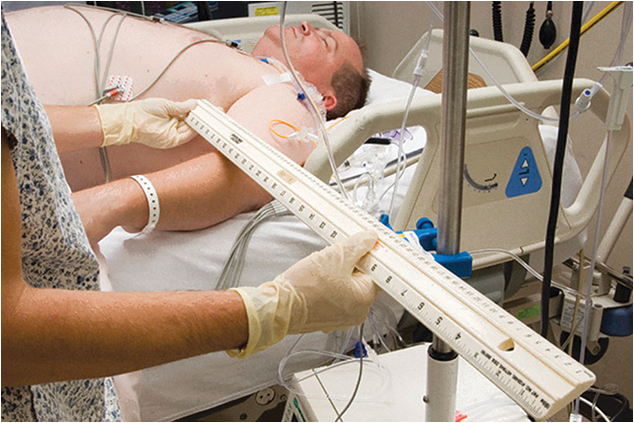
To obtain values, position the patient flat. If they can't tolerate this position, elevate the bed to 30 degrees. Locate the level of the right atrium by identifying the phlebostatic axis. Zero the transducer, leveling the transducer air–fluid interface stopcock with the right atrium, as shown in the below photograph. Read the CVP value from the digital display on the monitor, and note the waveform. Make sure that the patient is still when the reading is taken to prevent artifact. Use this position (flat or 30 degrees) for all subsequent readings and when zeroing the transducer.
Intrathoracic pressure varies with respiration, which in turn impacts the CVP value. The ideal point in time at which to measure the CVP is at end expiration, when intrathoracic pressure is closest to atmospheric pressure.
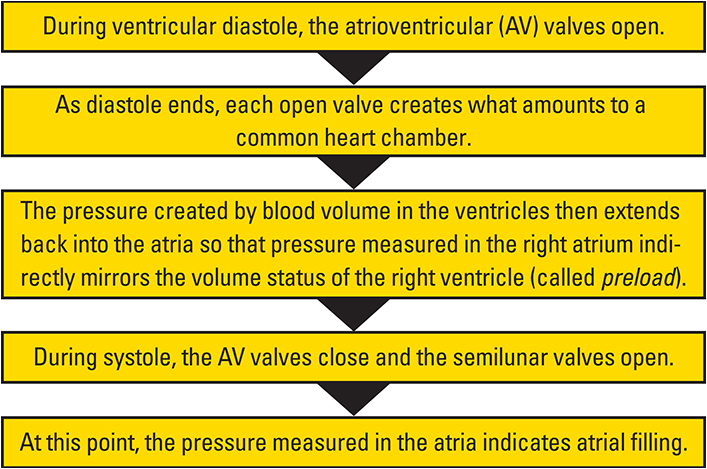
Correlating CVP with cardiac function
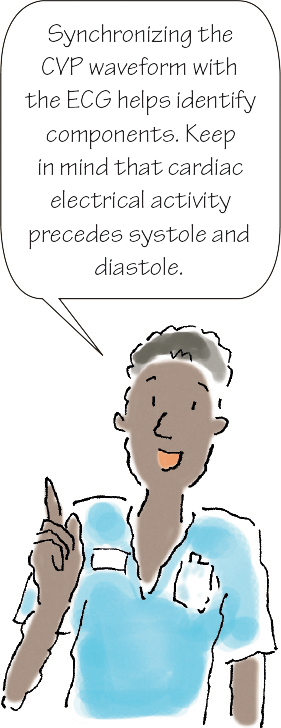
Essentially, CVP measurements reflect events in the cardiac cycle and, thus, depict cardiac function. See the flow chart below for more information.
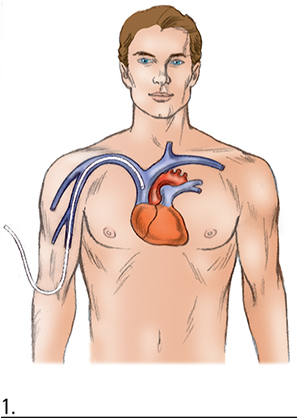
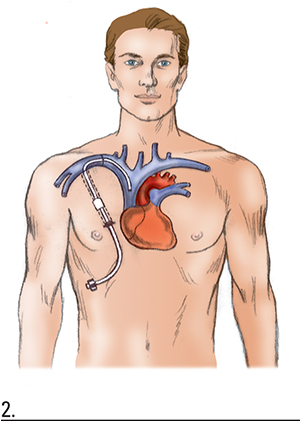
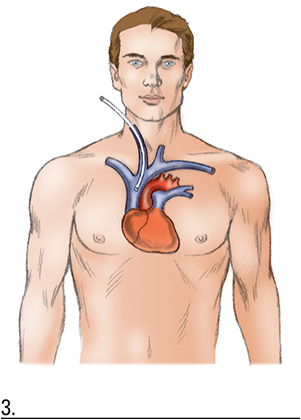
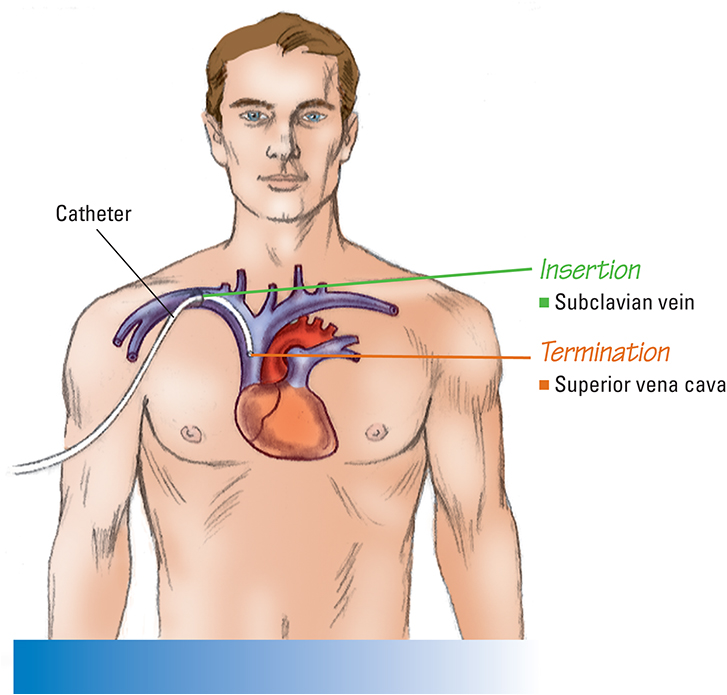
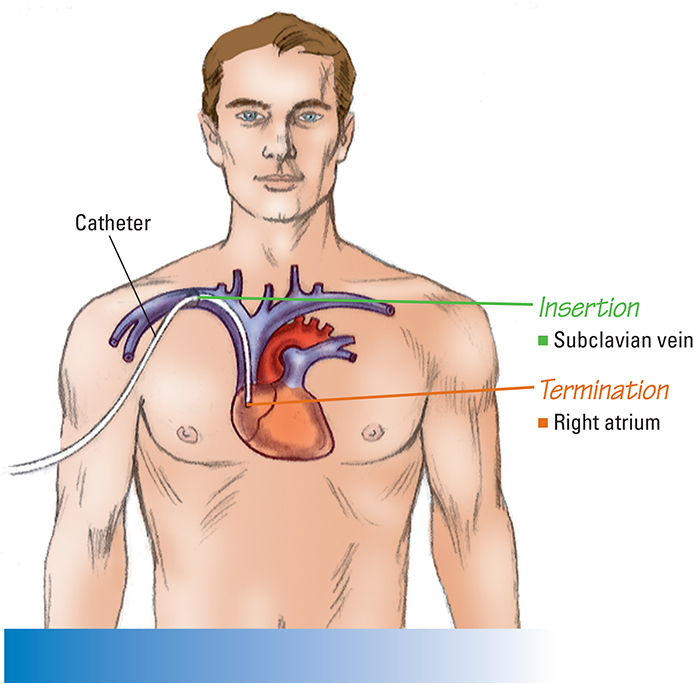
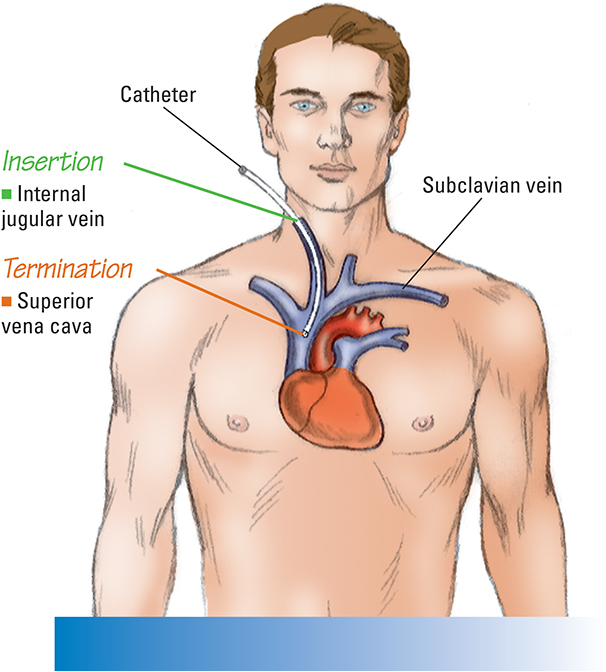
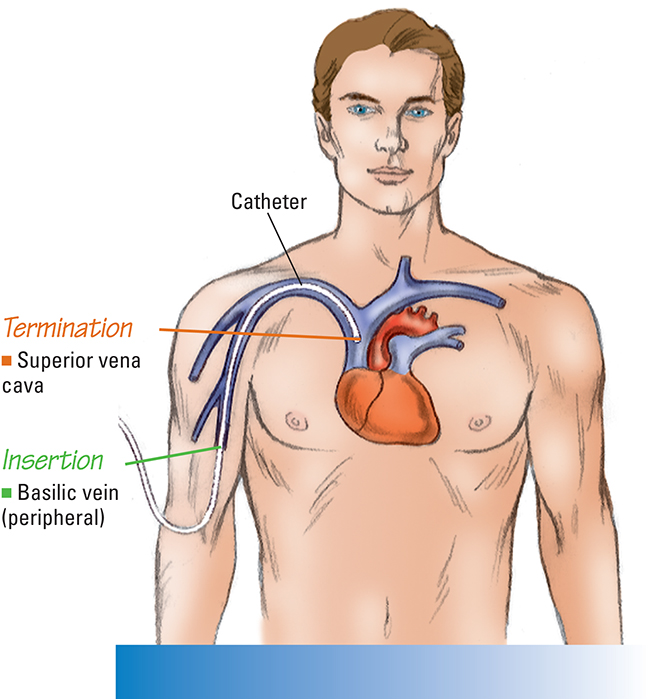
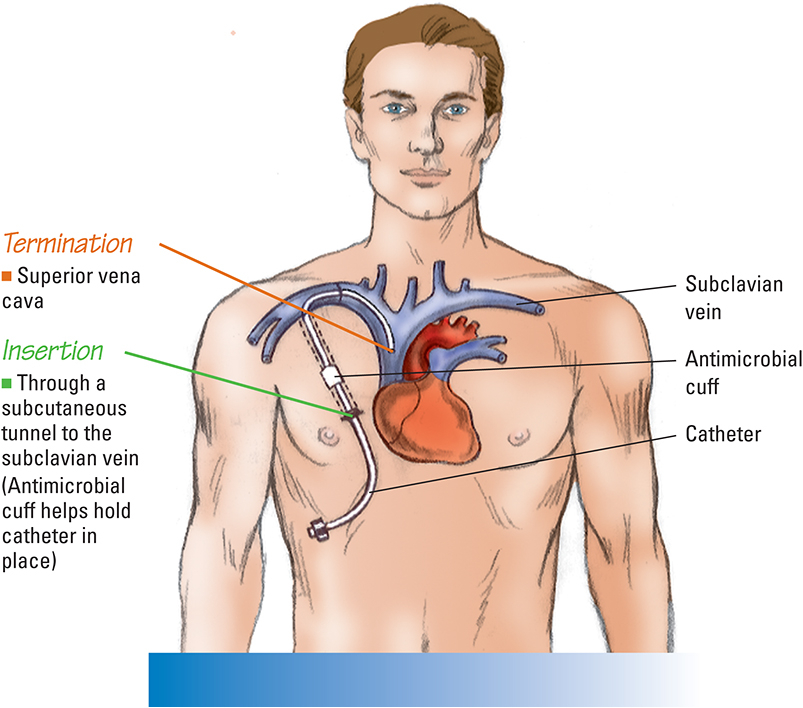
Central venous catheter pathways
The illustrations in this section show several common pathways for CV catheter insertion. Typically, a CV catheter is inserted in either the subclavian or internal jugular vein.
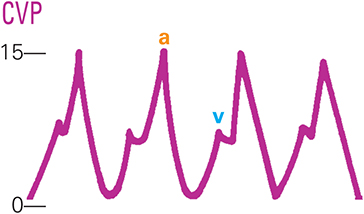
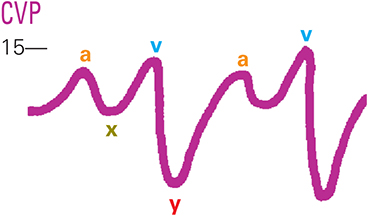
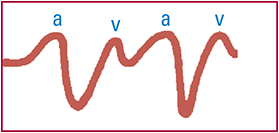
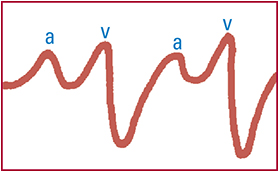
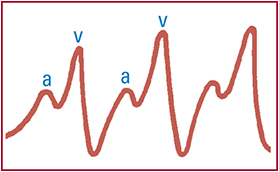
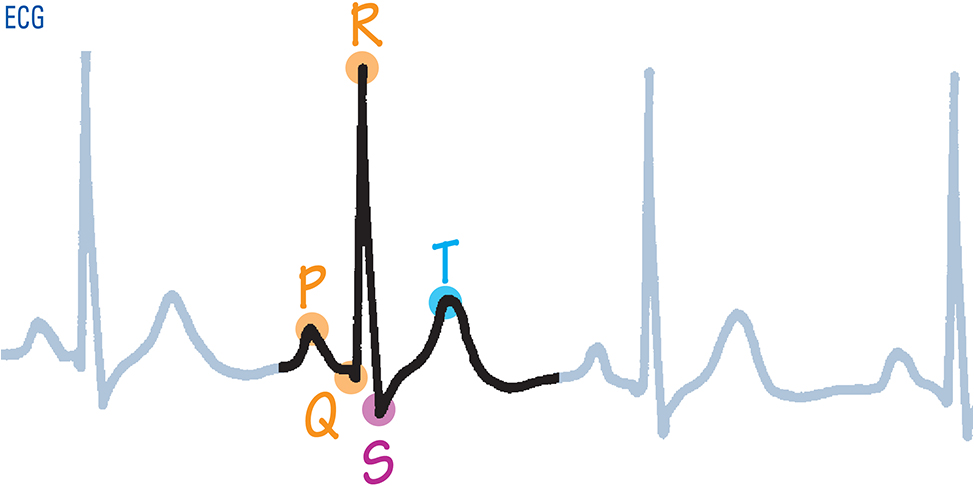
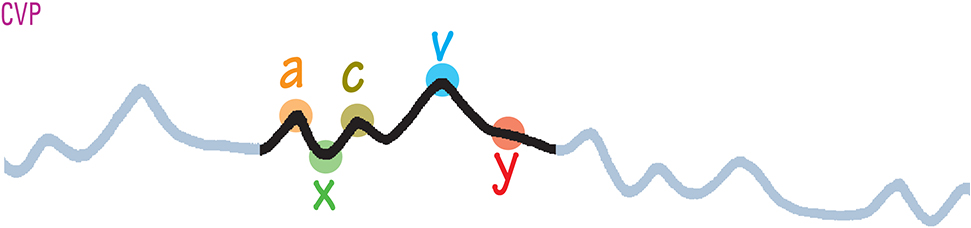
Follow the wave
Normal CVP waveforms The following figures show normal waveforms.
|
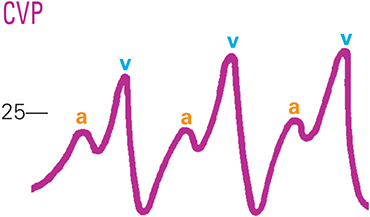
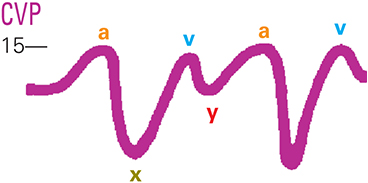
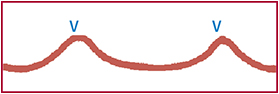
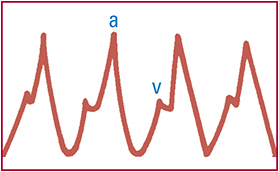
Abnormal CVP waveforms Elevated a wave
Physiologic causes
Associated conditions
Elevated v wave
Physiologic cause
Associated conditions
Physiologic causes
Associated conditions
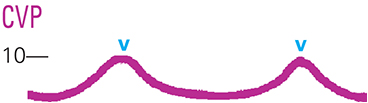
Absent a wave
Physiologic cause
Associated conditions
|