


C.22. What is thromboelastometry? How can it guide transfusion?
Answer:
Rotational thromboelastography (ROTEM) and thromboelastography (TEG) are point-of-care viscoelastic hemostatic assays (VEAs) used to assess clot kinetics. Both tests employ a suspended pin that sits in a conical cup containing whole blood. As a clot forms with the addition of an activator, the change in resistance is detected by VEA and plotted as a thromboelastogram. Results can then be used to tailor transfusion therapy in trauma resuscitation by goal-directed coagulation therapy; nevertheless, VEA has not been shown to improve mortality.
Rotation Thromboelastography
ROTEM uses a rotating pin in a stationary cup to detect increases in tensile force as a clot forms. It determines several different clotting parameters:
HEPTEM—the intrinsic pathway of the coagulation cascade with the addition of heparinase, which removes the effects of heparin from the results
FIBTEM—extrinsic pathway of the coagulation cascade with the addition of cytochalasin D, which inhibits the effects of platelets on clot formation
APTEM—extrinsic pathway with the addition of aprotinin to block fibrinolysis
These tests generate images based on the coagulation status, which can be used to guide transfusion therapy (Figures 57.1-57.6). Algorithms have been developed to guide therapy based on ROTEM results (Figure 57.7).
Figure 57.1.: Basic ROTEM Thromboelastogram.
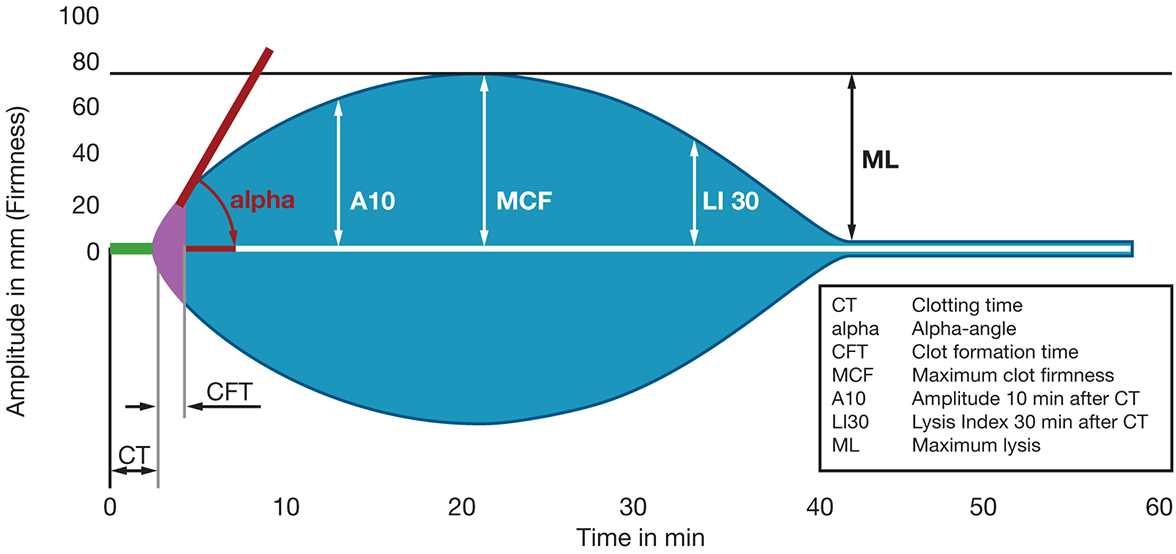
Basic ROTEM thromboelastogram. Clotting time (CT): the measured time until clot formation starts; affected by clotting factors and anticoagulants. Clot formation time (CFT): a measure of the initial rate of clot formation, the time from clot formation until the clot forms to an amplitude of 20 mm; depends on platelets and fibrinogen. α Angle: a measure of the initial rate of clot formation. Maximum clot firmness (MCF): the maximum tensile strength of the clot; describes the quality of the clot and is dependent on platelets, fibrinogen, factor XIII, and fibrinolysis. Maximum lysis (ML): reduction of clot firmness during measurement; abnormality in the ML at 30 minutes indicated fibrinolysis. Amplitude: A5/A10/A15 is the amplitude of the clot at 5, 10, and 15 minutes.
Figure 57.2.: ROTEM in a Patient with Normal Coagulation Parameters.
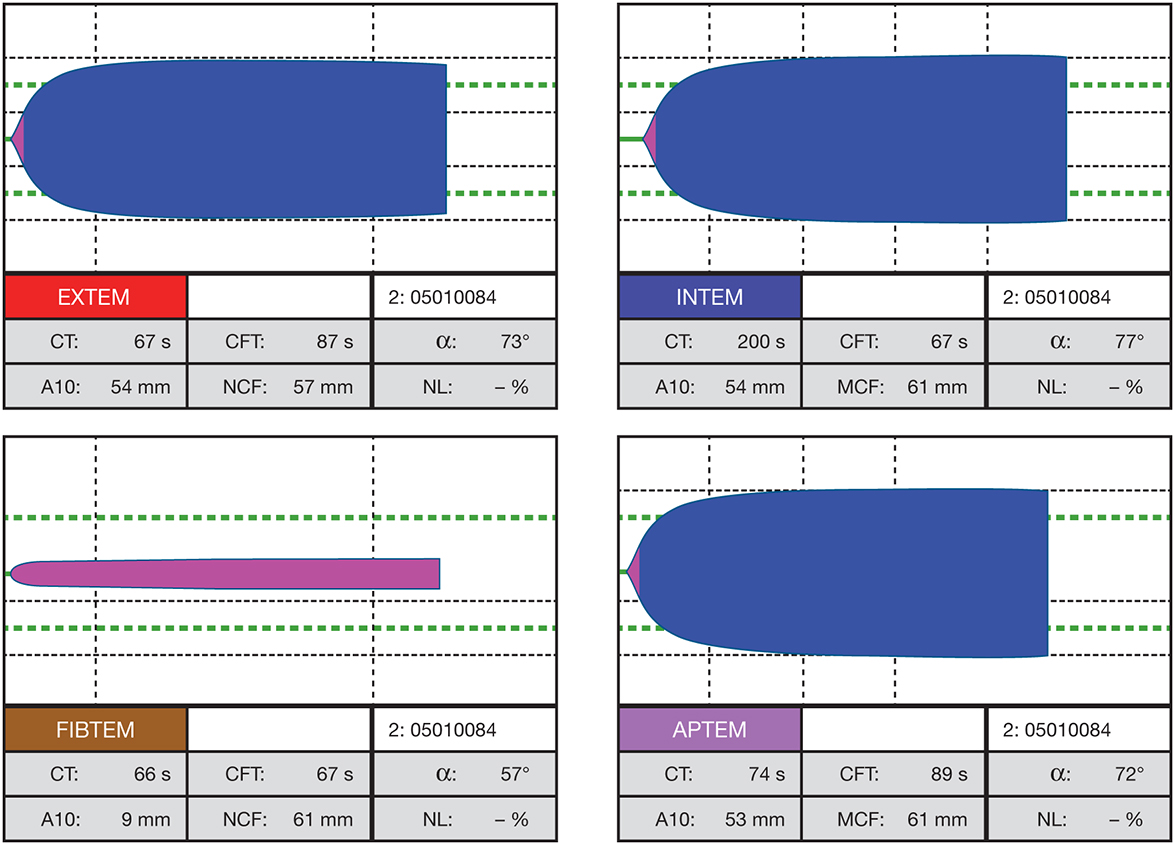
ROTEM in a patient with normal coagulation parameters.
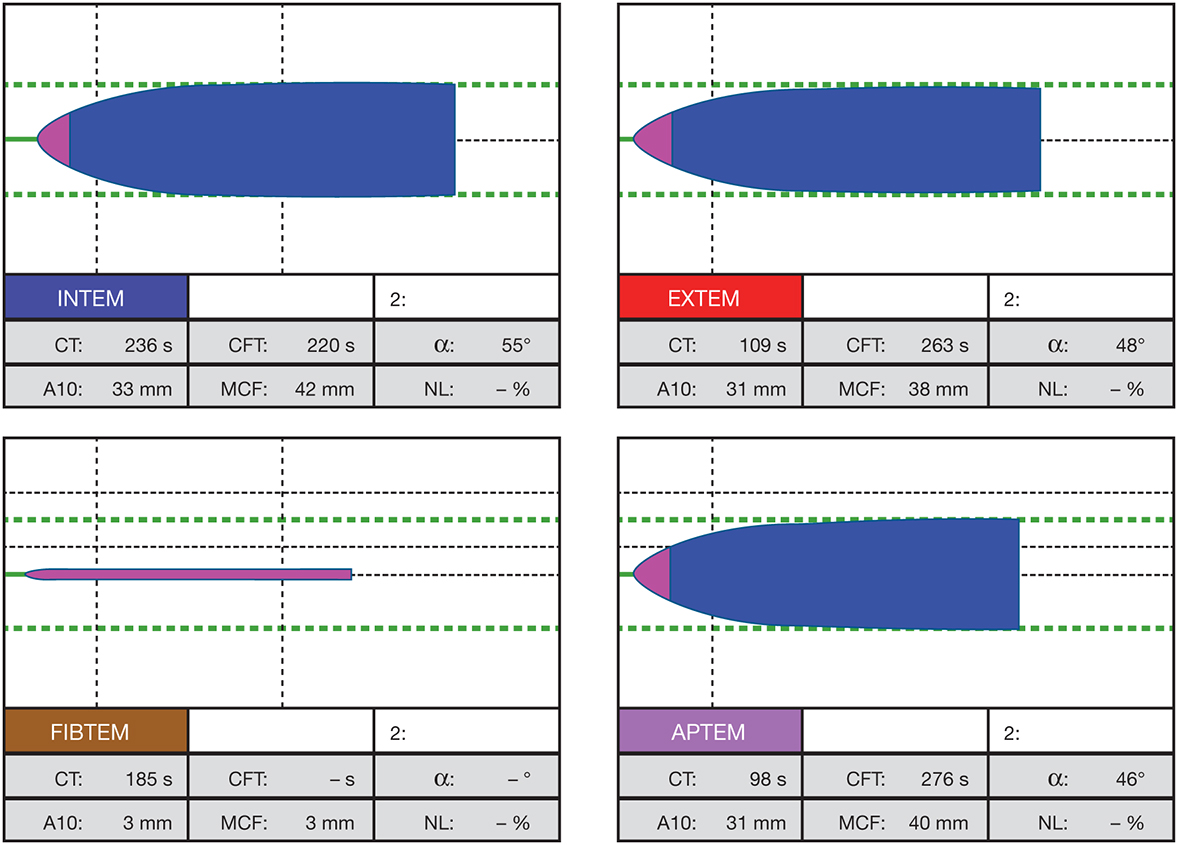
Figure 57.3.: ROTEM in a Patient with a Platelet Deficiency.
ROTEM in a patient with a platelet deficiency.
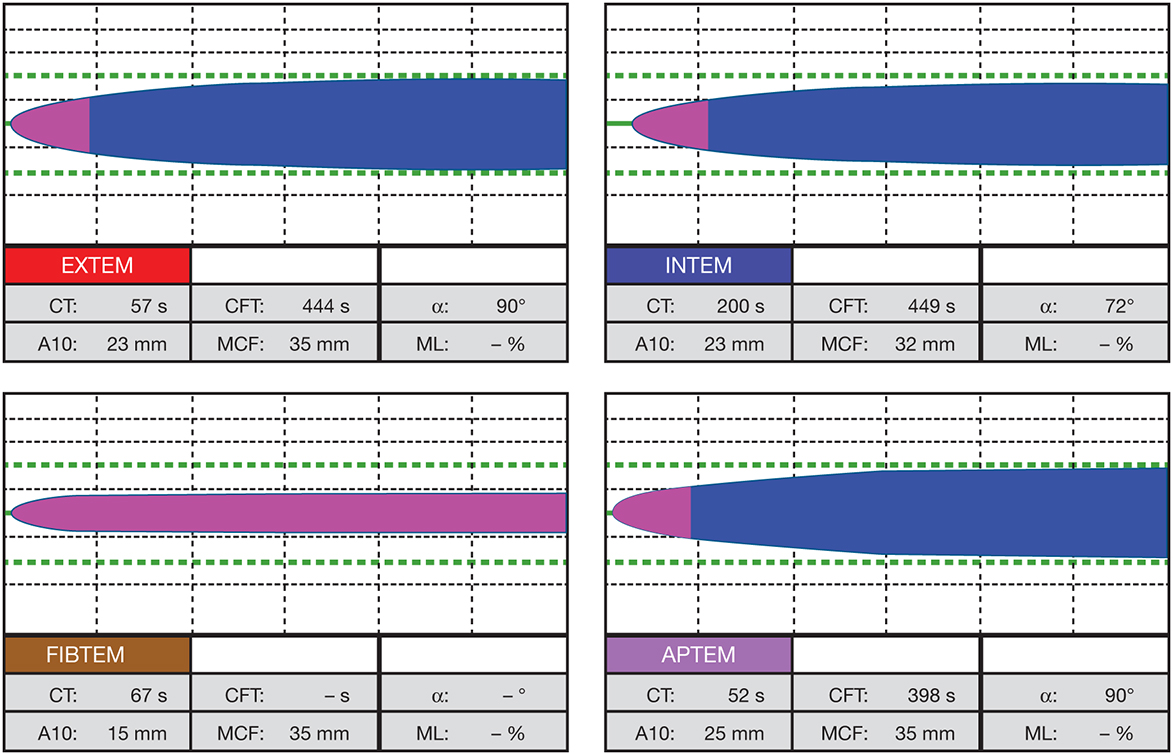
Figure 57.4.: ROTEM in a Patient with a Fibrinogen Deficiency.
ROTEM in a patient with a fibrinogen deficiency.
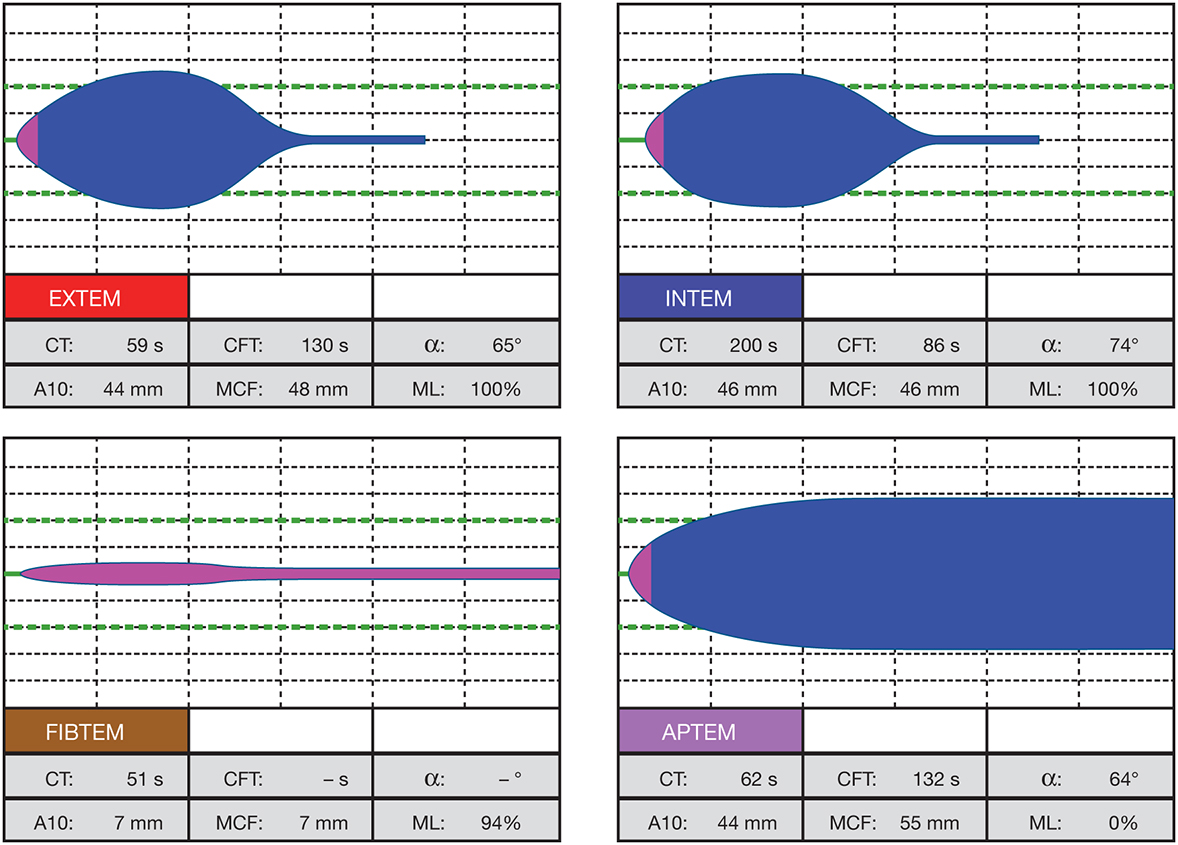
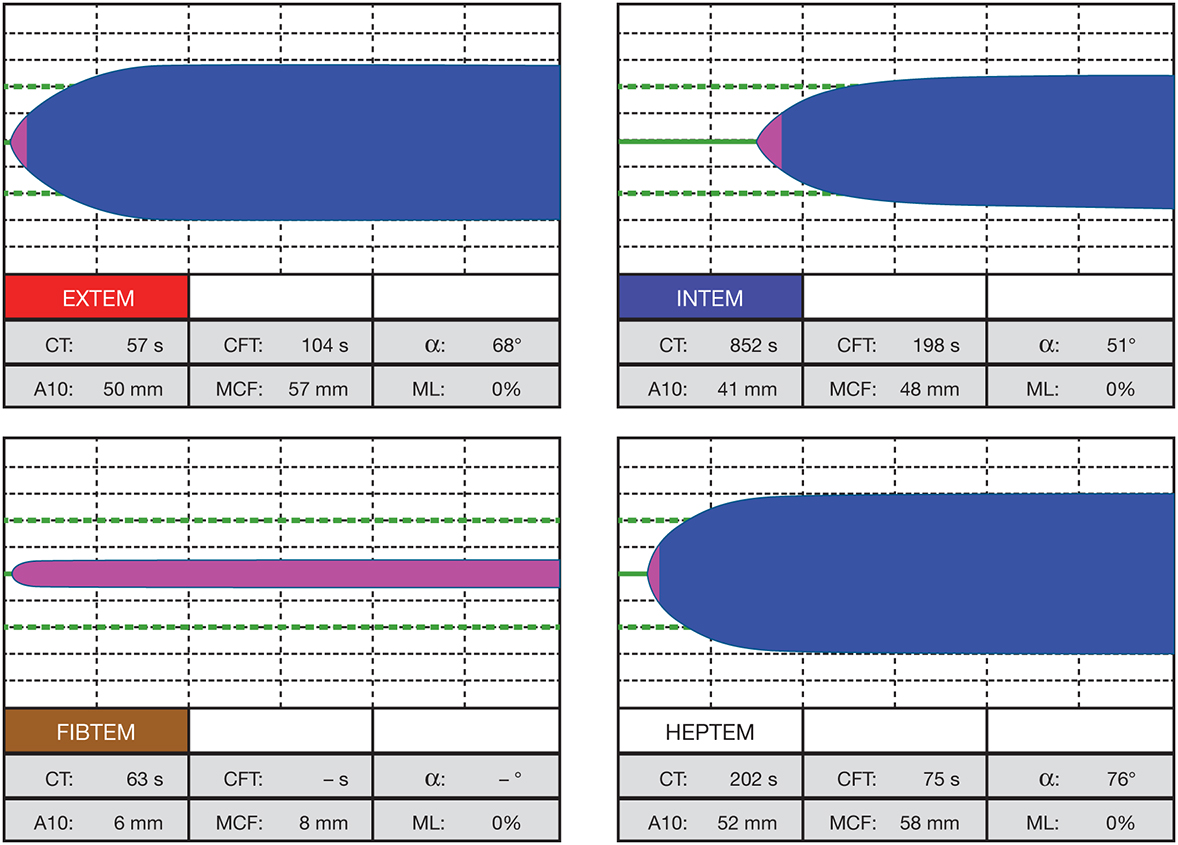
Figure 57.7.: Guide to Therapy Based on ROTEM Results. 
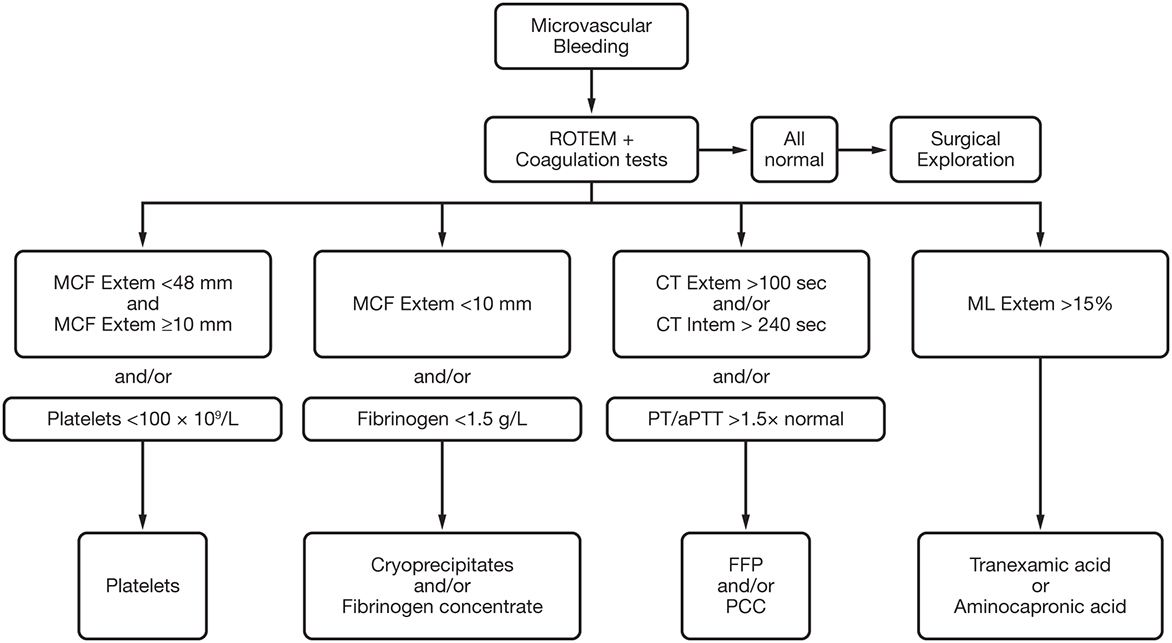
Guide to therapy based on ROTEM results. aPTT, activated partial thromboplastin time; CT, computed tomography; FFP, fresh frozen plasma; MCF, maximum clot firmness; ML, maximum lysis; PCC, prothrombin complex concentrate; PT, prothrombin time. (Reprinted from Bolliger D, Seeberger MD, Tanaka KA. Principles and practice of thromboelastography in clinical coagulation management and transfusion practice. Transfus Med Rev. 2012;26:1-13. Copyright © 2012 Elsevier. With permission.)
Thromboelastography
TEG is based on the same principles as ROTEM except that instead of having a mobile pin in a stationary cup, TEG has a stationary pin in a mobile cup (Figure 57.8). TEG values can be compared to ROTEM values (Table 57.1). Some examples of the effect of different coagulation states on TEG (Figure 57.9) and a guideline for transfusion therapy (Figure 57.10) are shown.
Table 57.1: Thromboelastography (TEG) Values Compared to Their Rotational Thromboelastometry (ROTEM) Equivalents
| TEG | Measures | ROTEM Equivalent |
|---|---|---|
| R time | Time to 2 mm amplitude | CT |
| K time | Time from 2 to 20 mm | CFT |
| αAngle | The slope between R and K | αAngle |
| MA | Maximum amplitude of clot | MCF |
| LY30 | Percentage of clot lysis at 30 min after MA | ML |
| A30 | Size of a clot at 30 min after MA | A10 |
| G | Clot elasticity | MCE |
| CI | The coagulation index is the value determined by a manufacturer-created mathematical formula which takes into account R, K, α angle, and MA to give an overall assessment of the state of coagulation. | |
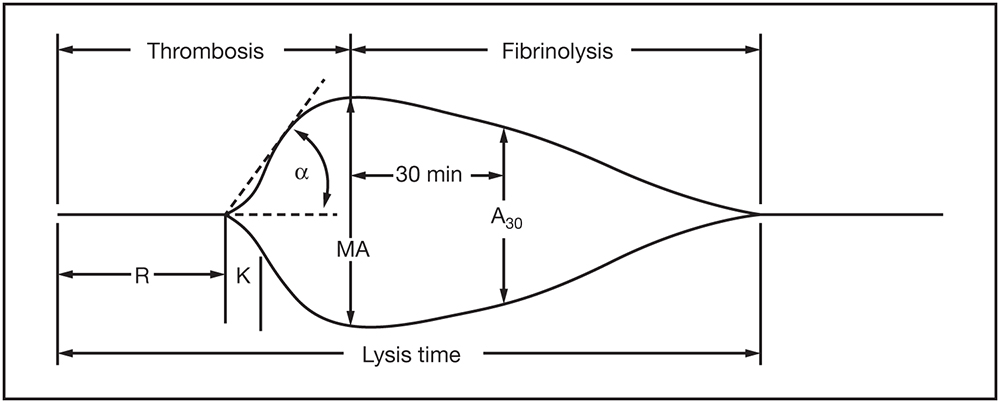
Figure 57.9.: Effects of Different Coagulation States on TEG Results.
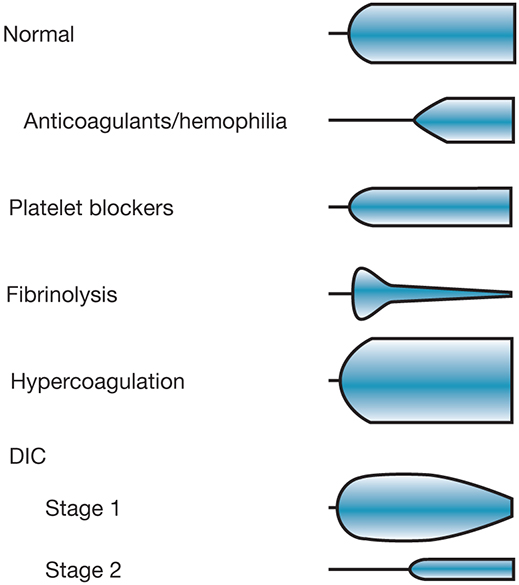
Effects of different coagulation states on TEG results.DIC, disseminated intravascular coagulation; TEG, thromboelastography.
Figure 57.10.: A Guideline for Transfusion Based on TEG Results.
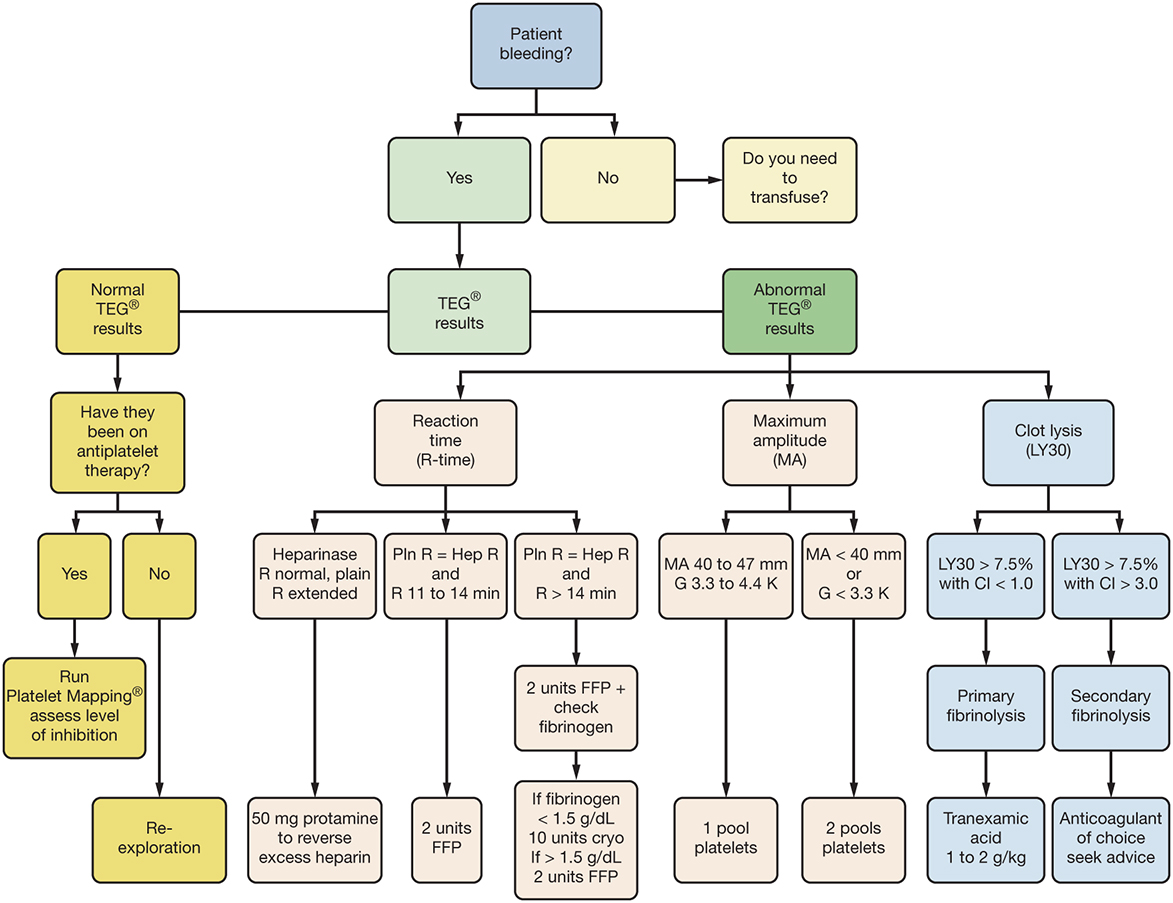
A guideline for transfusion based on TEG results. CI, coagulation index; FFP, fresh frozen plasma; G, clot elasticity; K, kinetics; MA, maximum amplitude; Pln, plain; TEG, thromboelastography.
References
- Baksaas-Aasen K, Gall LS, Stensballe J, et al. Viscoelastic haemostatic assay augmented protocols for major trauma haemorrhage (ITACTIC): a randomized, controlled trial. Intensive Care Med. 2021;47:49-59.
- Bolliger D, Seeberger MD, Tanaka KA. Principles and practice of thromboelastography in clinical coagulation management and transfusion practice. Transfus Med Rev. 2012;26:1-13.
- Jackson GN, Ashpole KJ, Yentis SM. The TEG vs the ROTEM thromboelastography/thromboelastometry systems. Anaesthesia. 2009;64:212-215.
- Johansson PI, Stissing T, Bochsen L, et al. Thrombelastography and thromboelastometry in assessing coagulation in trauma. Scand J Trauma Resusc Emerg Med. 2009;17:45.
- Ogawa S, Szlam F, Chen EP, et al. A comparative evaluation of rotation thromboelastometry and standard coagulation tests in hemodilution-induced coagulation changes after cardiac surgery. Transfusion. 2012;52:14-22.
- TEM Systems. Result interpretation. Accessed April 15, 2023. http://www.rotem-usa.com/methodology/result-interpretation/