What is the human-technology interface? Broadly speaking, any time a human uses technology, some type of hardware or software enables and supports the interaction. It is this hardware and software that define the interface and how the user will interact with it, the user interface (UI). The user experience (UX) is the user's experience from interacting with an object, product, or service. It has been connected to the term usability and refers to the design of products and services with the user in mind in order to meet the user's needs. There are bad designs and good designs. We have all encountered things that we felt should have been designed better. The array of light switches described previously was actually an interface (although not a great one) between the lighting technology in the room and the human user.
In today's healthcare settings, one encounters a wide variety of human-technology interfaces. Those who work in hospitals may use bar-coded identification cards to log in their arrival time to a human resources management system. Using the same cards, they might log in to their patients' EHRs, access their patients' drugs from a drug administration system, and even administer the drugs using bar-coding technology. Other examples of human-technology interfaces one might encounter include a defibrillator, a patient-controlled analgesia (PCA) pump, any number of physiological monitoring systems, electronic thermometers, and telephones and pagers. Rice and Tahir (2014) examined research that stressed the essence of human-technology interfacing, the human factor. They stated that
recent studies have found that rapid implementation of new medical technology-electronic health records, patient monitoring devices, surgical robots and other tools-can lead to adverse patient events when it is not thoughtfully integrated into workflow. The right processes require understanding the devices and the users. Testing in controlled environments often does not adequately consider the “human factor,” or how people interact with technology in high-pressure, real-life situations. (p. 12)
The human interfaces for each of these technologies are different and can even differ among different brands or versions of the same device. For example, to enter data into an EHR, one might use a keyboard, a light pen, a touch screen, or their voice. Healthcare technologies may present information via computer screen, printer, or smartphone. Patient data might be displayed in the form of text, images (e.g., the results of a brain scan), or sound (an echocardiogram); in addition, the information may be presented differently, based on roles and preferences. Dumon's (2017) statement is still timely: “Technology does not determine human action; human action shapes technology. As we push forward into this age of the marriage of data and technology, we must apply the basic principle that technology needs to serve humanity, first and last” (para. 9).
Some human-technology interfaces mimic face-to-face human encounters. For example, faculty members are increasingly using videoconferencing technology to communicate with their students. Similarly, telehealth allows nurses to use telecommunication and videoconferencing software to communicate more effectively and frequently with patients at home by using the technology to monitor patients' vital signs, supervise their wound care, or demonstrate a procedure. To provide comprehensive, quality healthcare interventions, we must fully leverage these tools, take all human factors into account, and make sure they are included in the healthcare provider's clinical workflow. Telehealth technology has fostered other virtual interfaces, such as system-wide intensive care units in which intensivists and specially trained nurses monitor critically ill patients in intensive care units, some of whom may be in rural locations. Sometimes telehealth interfaces allow patients to interact with a virtual clinician (a computer program such as an artificial intelligence [AI] agent or robot) that asks questions, provides social support, and tailors education to identify patient needs based on the answers to screening questions. These human-technology interfaces have been remarkably successful; sometimes patients even prefer them to live clinicians.
Human-technology interfaces may present information using text, numbers, images, icons, or sound. Auditory, visual, or tactile alarms may alert users to important information. Users may interact with (or control) the technology via keyboards, digital pens, voice activation, or touch.
A small but growing number of clinical and educational interfaces rely heavily on tactile input. For example, many students learn to access an intravenous site using virtual technology. Other, more sophisticated virtual reality applications help physicians learn to do endoscopies or practice complex surgical procedures in a safe environment. Still others allow drug researchers to design new medications by combining virtual molecules (here, the tactile response is quite different for molecules that can be joined from those that cannot). In each of these training environments, accurately depicting tactile sensations is critical. For example, feeling the kind and amount of pressure required to penetrate the desired tissues, but not others, is essential to a realistic and effective learning experience.
The growing use of large databases for research has led to the design of novel human-technology interfaces that help researchers visualize and understand patterns in the data that generate new knowledge or lead to new questions. Many of these interfaces now incorporate multidimensional visualizations in addition to scatter plots, histograms, or cluster representations (Matange et al., n.d.; Vincent et al., 2010). Some designers, such as Quinn (the founder of the Design Rhythmics Sonification Research Laboratory at the University of New Hampshire) and Meeker (2001), began using variations in sound to help researchers hear the patterns in large data sets. In Quinn and Meeker's climate symphony, a variety of musical instruments, tones, pitches, and phrases are mapped onto variables, such as the amounts and relative concentrations of minerals, to help researchers detect patterns in ice core data covering more than 110,000 years. Climate patterns take centuries to emerge and can be difficult to detect. The music allows the entire 110,000 years to be condensed into just a few minutes, making detection of patterns and changes much easier. The ability to quickly model, analyze, assess, synthesize, and discover patterns in large data sets is critical to the future of health care. As the previous examples demonstrated, there are evolving effective ways to model complex healthcare data, visualizing impactful data, and uncovering patterns (Agency for Healthcare Research and Quality, 2019; Kaul, 2020). Healthcare data visualization is flourishing with the increased awareness of the power afforded from the graphical representation of healthcare data. “Data visualization in the healthcare industry is the representation of complex medical stats in a digestible graphical format. It allows users to easily obtain qualitative insights, changes, patterns, and trends while drawing valuable conclusions . . . even without developed math skills (Khristich, 2023, para. 5).

A healthcare professional in a scrub suit with a stethoscope draped around her neck, interacts with a touchscreen displaying a 3D image adorned with various medical symbols.
© Thomas Andreas/Shutterstock, Inc.
The human-technology interface is ubiquitous in health care and takes many forms. A look at the quality of these interfaces follows. Be warned, though. It is not always a pretty picture.
A healthcare professional in a lab coat with a stethoscope draped around her neck, interacts with a touchscreen displaying a 3D image adorned with various medical symbols.
© Innocenti/Cultura/Getty Images
A person's hand makes contact with a touchscreen presenting a three-dimensional image of an E C G graph.
© Carlos Amarillo/Shutterstock, Inc.
In The Human Factor, Vicente (2004) cited the many safety problems in health care identified by the Institute of Medicine's (2000) seminal report, To Err Is Human: Building a Safer Health System, and noted how the technology (defined broadly) used often does not fit well with human characteristics. As a case in point, Vicente described his own studies of nurses' PCA pump errors. Nurses made the errors in large part because of the complexity of the user interface, which required as many as 27 steps to program the device. Vicente and his colleagues developed a PCA in which programming required no more than 12 steps. Nurses who used it in laboratory experiments made fewer errors, programmed drug delivery faster, and reported lower cognitive workloads compared to using the commercial device. Further evidence that human-technology interfaces do not work as well as they might is evident in the following events.
Doyle (2005) reported that when a bar-coding medication system interfered with nurses' workflow, they devised workarounds, such as removing the armband from the patient and attaching it to the bed because the bar-code reader failed to interpret barcodes when the bracelet curved tightly around a small arm. Koppel et al. (2005) reported that a widely used computerized physician order entry (CPOE) system meant to decrease medication errors actually facilitated 22 types of errors because the information needed to order medications was fragmented across as many as 20 screens, available medication dosages differed from those the physicians expected, and allergy alerts were triggered only after an order was written.
Han et al. (2005) reported increased mortality among children admitted to Children's Hospital in Pittsburgh after CPOE implementation. Three reasons were cited for this unexpected outcome. First, CPOE changed the workflow in the emergency room. Before CPOE, orders were written for critical time-sensitive treatment based on radio communication with the incoming transport team before the child arrived. After CPOE implementation, orders could not be written until the patient arrived and was registered in the system (a policy that was later changed). Second, entering an order required as many as 10 clicks and took as long as 2 minutes; moreover, computer screens sometimes froze or response time was slow. Third, when the team changed its workflow to accommodate CPOE, face-to-face contact among team members diminished. Despite the problems with study methods identified by some of the informatics community, there certainly were serious human-technology interface problems.
In 2005, a Washington Post article reported that Cedars-Sinai Medical Center in Los Angeles had shut down a $34 million system after 3 months because of the medical staff's rebellion. Reasons for the rebellion included the additional time it took to complete the structured information forms, failure of the system to recognize misspellings (as nurses had previously done), and intrusive and interruptive automated alerts (Connolly, 2005). Even though physicians actually responded appropriately to the alerts, modifying or canceling 35% of the orders that triggered them, designers had not found the right balance of helpful-to-interruptive alerts. The system simply did not fit the clinicians' workflow.
Such unintended consequences (Ash et al., 2004) or unpredictable outcomes (Aarts et al., 2004) of healthcare information systems may be attributed in part to a flawed implementation process, but there were clearly also human-technology interaction issues. That is, the technology was not well matched to the users and the context of care. In the pediatrics case, a system developed for medical-surgical units was implemented in a critical care unit.
Human-technology interface problems are the major cause of as many as 87% of all patient monitoring incidents (Walsh & Beatty, 2002). It is not always that the technology itself is faulty. In fact, the technology may perform flawlessly, but the interface design may lead the human user to make errors (Vicente, 2004).
Rice and Tahir (2014) reported on two errors that remind us we still have a long way to go to ensure patient safety. In 2011, a pop-up box on a digital blood glucose reader was misread, and the patient was given too much insulin, which sent her into a diabetic coma. In 2013, a patient did not receive his psychiatric medicine for almost 3 weeks because the pharmacy's computer system was set to automatically discontinue orders for certain drugs and there was no alert built in to notify the team providing care to this patient that the drug was suspended. The real issue is that the healthcare personnel-technology interfaces continue to cause these adverse events and near misses. It is important to remember that it is not only a technology or human interface issue. Many of these problems occur when new technology is introduced or existing technology is modified. In addition, we must examine how the technology tools are tested, the human users are prepared for their use, and the tools are integrated into the care delivery process (Rice & Tahir, 2014).
The Institute for Safe Medication Practices (2020) reflected on the seminal Institute of Medicine's report, To Err Is Human, and developed its top 10 most persistent medication and safety errors/issues. This list includes selecting the wrong medication after entering the first few letters of the drug name, errors due to look-alike labeling of manufacturers' products, misheard drug orders or recommendations during verbal/telephone communication, unsafe ability to override with automated dispensing cabinets (ADCs), unsafe practices associated with IV push medications, and wrong routes. It is important to note that errors and issues have continued more than two decades after the To Err Is Human report was issued. These errors are important to review since they reflect the work that has been done while making us aware of how much work is left to do when we add technologies to patient care. Please refer to Box 11-1: Interface Applications. We must be cognizant that new issues can arise from combining human factors and technology into patient care (American Society for Health Care and Risk Management, n.d.; The Joint Commission, 2023; Nuber, 2022; Sittig et al., 2018; USF Health, 2023).
| Box 11-1 Interface Applications |
|---|
| Reflect on These Interface Applications |
|---|
| Xerox (2023) listed 35 innovations that rocked or changed our world. We selected a few for you to critically think about in relation to how they affect health care. |
| Natural Language User Interfaces |
|---|
| Natural language processing (NLP) is a discipline of computer science concerning the relationship between computers and human language that requires machine learning skills from the disciplines of AI and computational linguistics. Our virtual assistants, such as Siri, Cortana, and Alexa, can respond to our questions or verbalized needs. As natural language interfaces evolve, they will help us speed up complex processes requiring extensive typing. This will enhance health care by allowing us to do the following: |
- Map unstructured text data elements to structured fields in an EHR to improve clinical data reliability and integrity
- Identify key elements, concepts, or phrases in lengthy blocks of a clinical note
- Reverse the process by converting data from machine-readable formats to natural language for reporting functions
- Conduct unique or distinct free text queries requiring multiple data sources to be synthesized to meet the query
|
| The Capacitive Touch Screen, or Touch Display |
|---|
| As opposed to the resistive touch screen, relying on the mechanical pressure made by your finger or a stylus, the capacitive touch screen, or touch display, uses the fact that our bodies are naturally conductive. The use of the electrical charges held in our fingertips makes tapping; swiping; scrolling; and resizing, such as zooming, easier. In the clinical setting, these displays can be used by gloved fingers. |
| Gesture Recognition |
|---|
| Gesture recognition requires the interpretation of human gestures via mathematical algorithms. Gestures can originate from any bodily motion, but typically they come from the face or hands. Emotion recognition is evolving.
Healthcare professionals use computer vision-based gesture recognition and wearable sensor-based gesture recognition. Surgeons can access patient data mid-surgery using a gesture, and doctors and nurses can similarly control robots. As pointed out by Xerox (n.d.), “When computers read gestures, the world is your interface” (para. 37).
|
| Near Field Communication Interface and Protocol |
|---|
| For people to be able to interact with devices and computers, the devices and computers must have smart ways to interact with each other. The standard that defines these communication modes is the Near Field Communication Interface and Protocol (NFCIP-1), which provides the communication network for these devices to be interconnected. This communication network uses near field communication (NFC) secure credentialing to network the products and consumer equipment in machine-to-machine or machine-to-object interaction. This provides the security that makes mobile payments practical.
Landman et al. (2014) developed an innovative use for a “near field communication-enabled medication administration (NFCMA) system taking advantage of a mobile device equipped with a reader for near field communication (NFC), a wireless communication protocol that allows secure exchange of small amounts of data by proximity or touch” (para. 9). Debnath et al. (2020) reported that their short transmission range makes NFC-based transactions very secure. In 2021, Aldughayfiq and Sampalli (2021) conducted a usability study and determined that an NFC-based mobile application could improve patient safety. The results demonstrate that their subjects thought the NFC application will decrease errors in the dispensing of medications. Landman et al.'s (2014) innovation positively affects medication administration, and NFC continues to be researched.
|
| Application Programming Interface |
|---|
| The application programming interface (API) is an interface or communication protocol between a server and a client. It is a computing interface to a software component or a system that defines how other components or systems can use it. The interface can be entirely customized; specific to a component of the system; or designed based on an industry standard to assure interoperability, which is key.
Xerox (n.d.) stated that “[s]oftware is certainly eating the world. But the web wouldn't be what it is without the proliferation of API bridges between all that software” (para. 39).
Healthcare applications involve building interoperability between EHRs, internal apps, and other data exchange tools, which necessitates the need for APIs to govern the flow of information among these disparate, distinct systems.
|
Much can be learned from the related fields of cognitive engineering, human factors, and ergonomics (Figure 11-1 and Figure 11-2) about how to make interfaces more compatible with their human users and the context of care. Each of these areas of study is multidisciplinary and integrates knowledge from multiple disciplines (e.g., computer science, engineering, cognitive engineering, psychology, and sociology).
Figure 11-1 Human Factors and Ergonomics
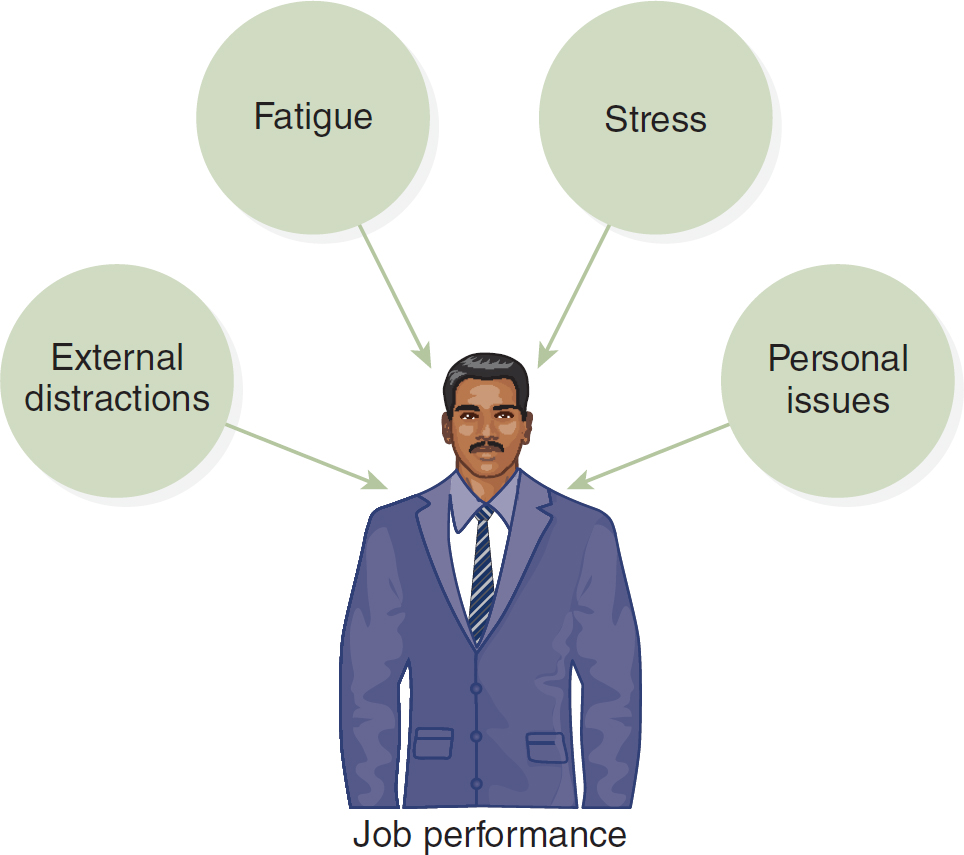
An illustration of a man in a suit depicts the elements influencing job performance, encompassing external distractions, fatigue, stress, and personal issues.
Figure 11-2 Human Factors and Ergonomics, Continued
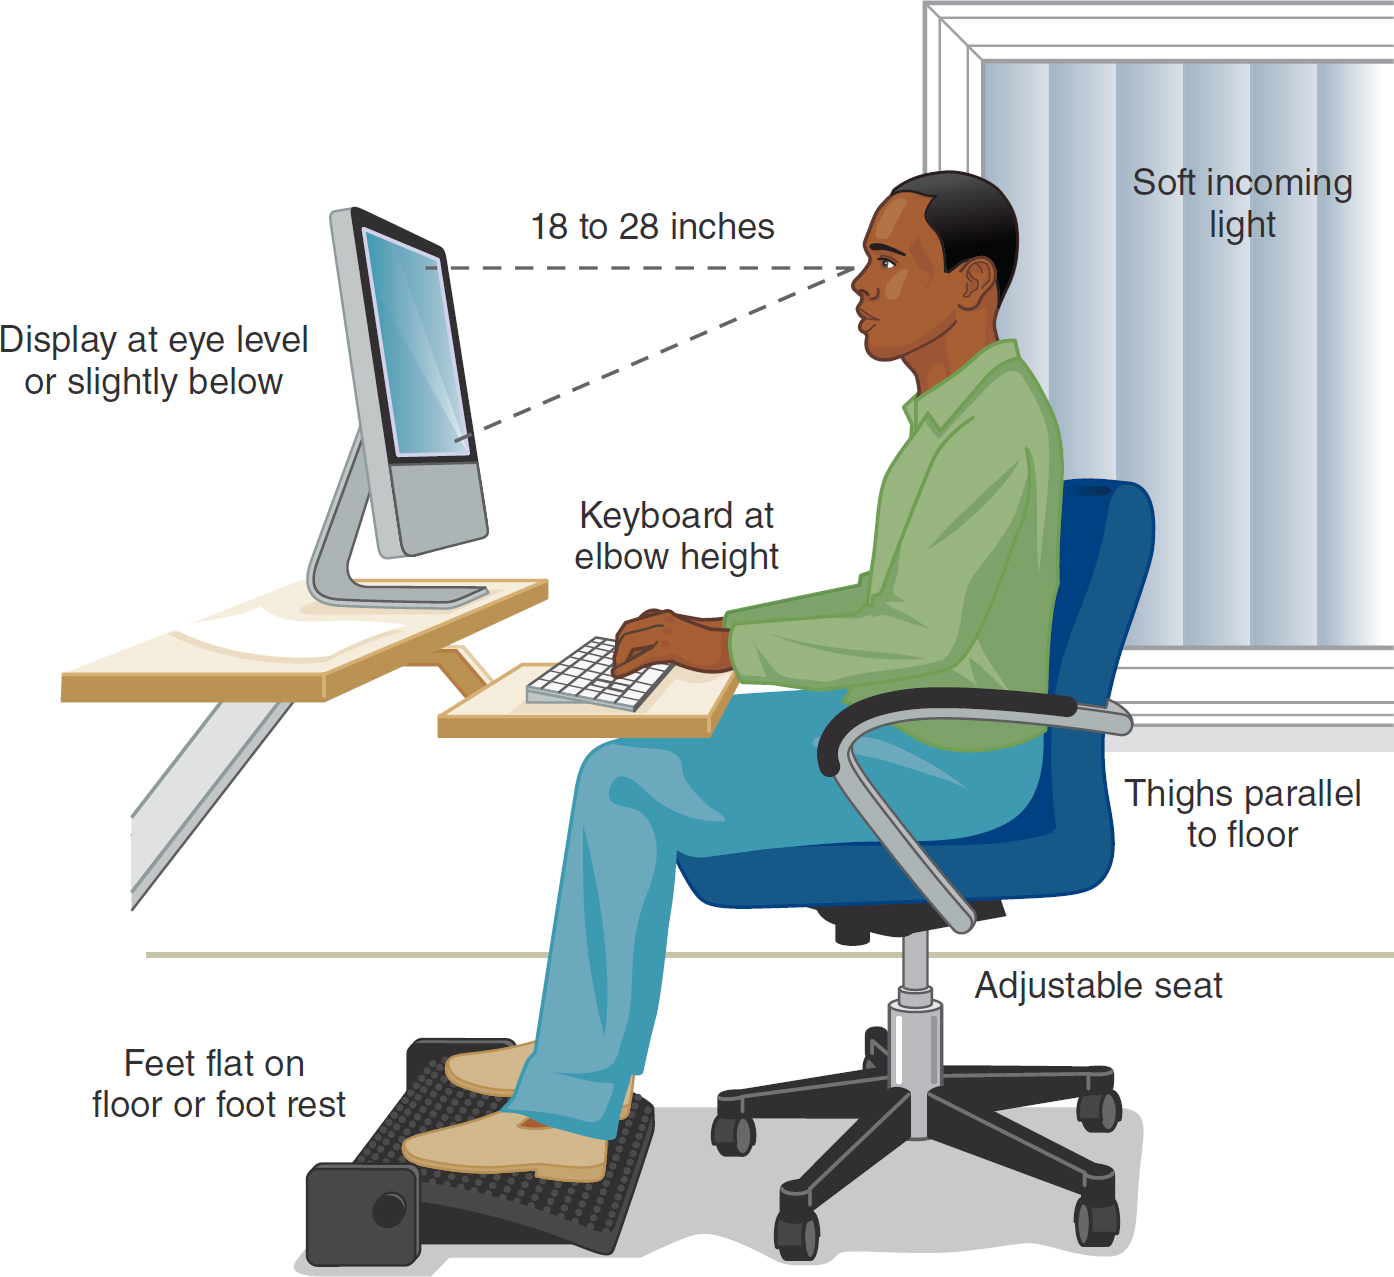
An illustration depicts the relationship between ergonomic principles and human factors.
The illustration features a man seated at a computer on a swivel chair with a footrest, positioned next to a window. Labeled elements include soft incoming light through the window, thighs parallel to the floor, an adjustable seat, feet flat on the floor or footrest, keyboard at elbow height, and display at eye level or slightly below of about 18 to 28 inches.
These areas are also concerned with health issues arising from computer and other technology use. Longo and Reese (2014) reminded us that
[n]early 20 years ago, the American Optometric Association termed computer vision syndrome (CVS) as the complex of eye and vision problems related to near work experienced while using a computer. CVS symptoms reflect the current broad diagnosis of asthenopia (ICD-9, 368.13) [2017 ICD-10-CM H53.149] also referred to as eyestrain. Symptoms include: fatigue, blurred distal or proximal vision, headache, dry or irritated eyes, neck and/or backaches, blurred near vision and diplopia (double vision). (p. 8)
Longo and Reese (2014) described how to prevent computer vision syndrome. One of the best ways to help your eyes is to remember to look 20 feet away from your screen every 20 minutes for a minimum of 20 seconds. With increased smartphone use, we are seeing neck issues caused by the tilt of the head (with the chin on the chest) while looking down at the smartphone or other handheld device. You should hold your phone up so that you are keeping your neck and eyes aligned properly with the device's screen for more comfortable viewing and interactions. We must all be aware of our posture and how our work areas are set up when using our computers, smartphones, tablets, and any other devices that consume a great deal of our time during our work or personal hours. See Box 11-2 for how to use a virtual reality headset.
| Box 11-2 Virtual Reality (VR) Headset Usage |
|---|
| A VR headset, or head-mounted display, is a wearable device that you place over your eyes like goggles and use it to fully engage in the VR environment. Here is a list of human-technology interface tips from the authors: |
- Always read the manufacturer's instructions and safety warnings before using any headset.
- Place your headset on and adjust it, based on the manufacturer's guidance, so that it feels comfortable; once you enter VR, make sure everything looks crisp and clear.
- Learn how to hold and use the controllers if applicable. They typically have a wrist strap, and it is suggested to use the strap to prevent the controllers from falling to the floor and being damaged.
- Clear your space so that you do not have any hazards while you move around in VR such as when you reach and extend your arms or walk around. Some people stay seated when they do not have a large enough area for safe movement.
- Begin slowly by building the amount of time you spend in VR. Access a program for 5 minutes and evaluate how you feel. If you do not feel any discomfort, keep the headset on for 15 to 30 minutes engaging in VR activities. If you feel discomfort, remove the headset, discontinue use, and rest. Try again later.
- It is suggested to take a 10 to 15 minute break for every 30 minutes of VR time or 30 minutes for every hour of VR.
- As your eyes and brain get accustomed to the headset and VR, you can increase your time in VR. It is not recommended to exceed 1 hour of continuous use, so remember to take breaks. You might even take up to 1-hour breaks after being in VR for 1 hour.
- Be mindful of your eyes and make sure that you look off into the distance after you remove the headset, just as you would if you are using a monitor and should change your eyes' focus often. Change the visual distance you focus on for your eyes.
In addition, Meta Quest (2023) recommended the following: - You must be 13+ years old.
- Only use indoors (keep headset away from direct sunlight).
- Take care of your headset by keeping it away from liquids or heat.
- Read and abide by their [Meta] current code of conduct.
- To protect youth, adults should monitor how their 13+ teens are using the Meta VR systems.
Meta Quest. (n.d.). Welcome to the Meta Quest safety center. www.oculus.com/safety-center |
Effken (2006) proposed an ecological approach to interface design to help us realize a more meaningful EHR. The ecological interface design (EID) is an approach to interface design that was introduced explicitly for multifaceted, complex sociotechnical, real-time, and dynamic systems; it has been applied in many fields, including health care. This approach supports knowledge workers in health care as they manage and adapt to change, innovation, and novelty. This approach was borrowed from a small field of psychology-ecological psychology-which helps the user identify deviations from normal physical or physiological processes. It is evident that users and clinicians need the technology and interfaces necessary to quickly comprehend the multiple discrete data that are contained in distinct parts of the EHR.
Over the years, three axioms have evolved for developing effective human-computer interactions: (1) Users must be an early and continuous focus during interface design; (2) the design process should be iterative, allowing for evaluation and correction of identified problems; and (3) formal evaluation should take place using rigorous experimental or qualitative methods (Staggers, 2003). It is important to note that the following axioms still apply today and that, even after all these years, are often not followed.
Axiom 1: Users Must Be an Early and Continuous Focus During Interface Design
Rubin (1994) used the term user-centered design to describe the process of designing products (e.g., human-technology interfaces) so that users can carry out the tasks needed to achieve their goals with “minimal effort and maximal efficiency” (p. 10). Thus, in user-centered design, the end user is emphasized. This is still a focus of human-technology interface design today.
Vicente (2004) argued that technology should fit human requirements at five levels of analysis (i.e., physical, psychological, team, organizational, and political). Physical characteristics of the technology (e.g., size, shape, or location) should conform to the user's size, grasp, and available space. Information should be presented in ways that are consistent with known human psychological capabilities (e.g., the number of items that can be remembered is seven plus or minus two). In addition, systems should conform to the communication, workflow, and authority structures of work teams; to organizational factors, such as culture and staffing levels; and even to political factors, such as budget constraints, laws, or regulations.
A number of analysis tools and techniques have been developed to help designers better understand the task and user environment for which they are designing. Discussed next are task analysis, cognitive task analysis, and cognitive work analysis.
Task analysis examines how a task must be accomplished. Generally, analysts describe the task in terms of inputs needed for the task, outputs (i.e., what is achieved by the task), and any constraints on actors' choices on carrying out the task. Analysts then lay out in flowcharts the sequence of temporally ordered actions that must be carried out to complete the task (Vicente, 1999). A worker's tasks must be analyzed. Task analysis is very useful in defining what users must do and which functions might be distributed between the user and technology (U.S. Department of Health and Human Services, 2013). Cognitive task analysis usually starts by identifying, through interviews or questionnaires, the particular task and its typicality and frequency. Then analysts may review the written materials that describe the job or are used for training and determine, through structured interviews or by observing experts perform the task, which knowledge is involved and how that knowledge might be represented. Cognitive task analysis can be used to develop training programs. Zupanc et al. (2015) reported on the use of cognitive task analysis techniques to develop a framework from which a colonoscopy training program could be designed. “Task analysis methods (observation, a think-aloud protocol and cued-recall) and subsequent expert review were employed to identify the competency components exhibited by practicing endoscopists with the aim of providing a basis for future instructional design” (p. 10). The resulting colonoscopy competency framework consisted of “twenty-seven competency components grouped into six categories: clinical knowledge; colonoscope handling; situation awareness; heuristics and strategies; clinical reasoning; and intra and inter-personal” (p. 10).
Cognitive work analysis (CWA) was developed specifically for the analysis of complex, high-technology work domains, such as nuclear power plants, intensive care units, and emergency departments, where workers need considerable flexibility in responding to external demands (Burns & Hajdukiewicz, 2004; Vicente, 1999). A complete CWA includes five types of analysis: (1) work domain, (2) control tasks, (3) strategies, (4) social-organizational, and (5) worker competencies. The work domain analysis describes the functions of the system and identifies the information that users need to accomplish their task goals. The control task analysis investigates the control structures through which the user interacts with or controls the system. It also identifies which variables and relations among variables discovered in the work domain analysis are relevant for particular situations so that context-sensitive interfaces can present the right information (e.g., prompts or alerts) at the right time. The strategies analysis looks at how work is actually done by users to facilitate the design of appropriate human-computer dialogues. The social-organizational analysis identifies the responsibilities of various users (e.g., doctors, nurses, clerks, or therapists) so that the system can support collaboration, communication, and a viable organizational structure. Finally, the worker competencies analysis identifies design constraints related to the users themselves (Effken, 2002).
Specialized tools are available for the first three types of CWA (Vicente, 1999). Analysts typically borrow tools (e.g., ethnography) from the social sciences for the two remaining types. Hajdukiewicz et al. (2001) used CWA to model an operating room environment. Effken (2002) and Effken et al. (2001) used CWA to analyze the information needs for an oxygenation management display for an intensive care unit. Other examples of the application of CWA in health care are described by Burns and Hajdukiewicz (2004) in their book, Ecological Interface Design. Ashoori et al. (2014) used team CWA to reveal the interactions of the healthcare team in the context of work models in a birthing unit. They felt that team CWA enhances CWA in complex environments, such as health care, that require effective teamwork because it reveals additional constraints relevant to the workings of the team. The information gleaned about the teamwork could be used for systems design applications.
Axiom 2: The Design Process Should Be Iterative, Allowing for Evaluation and Correction of Identified Problems
Today, both principles and techniques for developing human-technology interfaces that people can use with minimal stress and maximal efficiency are available. An excellent place to start is with Norman's (1988, pp. 188-189) principles:
- Use both knowledge in the world and knowledge in the head. In other words, pay attention not only to the environment or to the user but to both, and to how they relate. By using both, the problem actually may be simplified.
- Simplify the structure of tasks. For example, reduce the number of steps or even computer screens needed to accomplish the goal.
- Make things visible. Bridge the gulf of execution and the gulf of evaluation. Users need to be able to see how to use the technology to accomplish a goal (e.g., which buttons does one press and in which order to program this PCA?); if they do, then designers have bridged the gulf of execution. They also need to be able to see the effects of their actions on the technology (e.g., if a nurse practitioner prescribes a drug to treat a certain condition, the actual patient response may not be perfectly clear). This bridges the gulf of evaluation.
- Get the mappings right. Here, the term mapping is used to describe how environmental facts (e.g., the order of light switches or variables in a physiologic monitoring display) are accurately depicted by the information presentation.
- Exploit the power of constraints, both natural and artificial. Because of where the eyes are located in the head, humans have to turn their heads to see what is happening behind them; however, that is not true of all animals. As the location of one's eyes constrains what one can see, so also do physical elements, social factors, and even organizational policy constrain the way tasks are accomplished. By taking these constraints into account when designing technology, it can be made easier for human use.
- Design for error. Mistakes happen. Technology should eliminate predictable errors and be sufficiently flexible to allow humans to identify and recover from unpredictable errors.
- When all else fails, standardize. To get a feel for this principle, think how difficult it is to change from a Macintosh to a Windows environment or from the iPhone operating system to Android.
Kirlik and Muruyama (2004) described a real-world human-technology interface that follows Norman's principles. In their classic analogy, the authors observed how a busy expert short-order cook strategically managed to grill many hamburgers at the same time and each to the customer's desired level of doneness. The cook put the burgers that were to be well done on the back and far right portion of the grill, those to be medium well done in the center of the grill, and those to be rare at the front of the grill but farther to the left. The cook moved all the burgers to the left as grilling proceeded and turned them over during their travel across the grill. Everything the cook needed to know was available in this simple interface. As a human-technology interface, the grill layout was elegant. The interface used knowledge housed in both the environment and the expert cook's head; also, things were clearly visible, both the position of the burgers and the way they were moved. The process was clearly and effectively standardized, with built-in constraints. What might it take to create such an intuitive human-technology interface in health care?
Several useful books have been written about effective interface design (e.g., Burns & Hajdukiewicz, 2004; Cooper, 1995; Mandel, 1997; McKay, 2013; Wigdor & Wixon, 2011). Just as in other industries, health care is learning that big data can provide big insights if they can be visualized, accessed, and meaningful (Intel, n.d.). Often, designers use graphical objects to show how variables relate. The first to do so were likely Cole and Stewart (1993), who used changes in the lengths of the sides and area of a four-sided object to show the relationship of respiratory rate to tidal volume. Other researchers have demonstrated that histograms and polygon displays are better than numeric displays for detecting changes in patients' physiological variables (Gurushanthaiah et al., 1995). When Horn et al. (2001) presented physiological data via a single circular object with 12 sectors (where each sector represented a different variable), nurses reported that it was easy to recognize abnormal conditions but difficult to comprehend the patient's overall status. This kind of graphical object approach has been most widely used in anesthesiology, where a number of researchers have shown improved clinician situational awareness or problem-detection time by mapping physiological variables onto display objects that have meaningful shapes, such as using a bellows-like object to represent ventilation (Agutter et al., 2003; Blike et al., 2000; Michels et al., 1997; Zhang et al., 2002).
Effken (2006) compared a prototype display that represented physiological data in a structured pictorial format with two bar graph displays. Both the first bar graph display and the prototype presented data in the order that experts were observed to use them. The second bar graph display presented the data in the way that nurses collected them. In an experiment in which resident physicians and novice nurses used simulated drugs to treat observed oxygenation management problems using each display, residents' performance was improved with the displays ordered as experts used them, but nurses' performance was not improved. Instead, nurses performed better when the variables were ordered as they were used to collecting them, which demonstrated the importance of understanding user roles and the tasks they need to accomplish.
Data also must be represented in ways other than visually. Gaver (2010) proposed that because ordinary sounds map onto familiar events, they could be used as icons to facilitate easier technology navigation and use and provide continuous background information about how a system is functioning. In health care, auditory displays have been used to provide clinicians with information about patients' vital signs (e.g., in pulse oximetry), such as by altering volume or tone when a significant change occurs (Sanderson, 2006).
Admittedly, auditory displays are probably more useful for quieter areas of the hospital, such as the operating room. Perhaps that is why researchers have most frequently applied the approach in anesthesiology. For example, Loeb and Fitch (2002) reported that anesthesiologists detected critical events more quickly when auditory information about heart rate, blood pressure, and respiratory parameters was added to a visual display. An earcon is a brief or short distinctive sound representing a specific event or conveying some other bit of information such as the sound from your phone when you receive an email or a text that alerts you to check for the information just received. These are common in computer systems and applications, such as the computer beep signifying there is an error or a distinct sound indicating that a patient has allergies or something else that needs your attention. Auditory tones also have been combined as earcons to represent relationships among data elements, such as the relationship of systolic to diastolic blood pressure (Watson & Gill, 2004).
Axiom 3: Formal Evaluation Should Take Place Using Rigorous Experimental or Qualitative Methods
Perhaps one of the highest accolades that any interface can achieve is to say that it is transparent. An interface becomes transparent when it is so easy to use that users think only about the task at hand instead of the interface. For example, a transparent clinical interface would enable clinicians to focus on patient decisions rather than on how to access or combine patient data from multiple sources. In Figure 11-3, instead of the nurse interacting with the computer, the nurse and the patient interact through the technology interface. The more transparent the interface, the easier the interaction should be.
Figure 11-3 Nurse-Patient Interaction Framework in Which the Technology Supports the Interaction
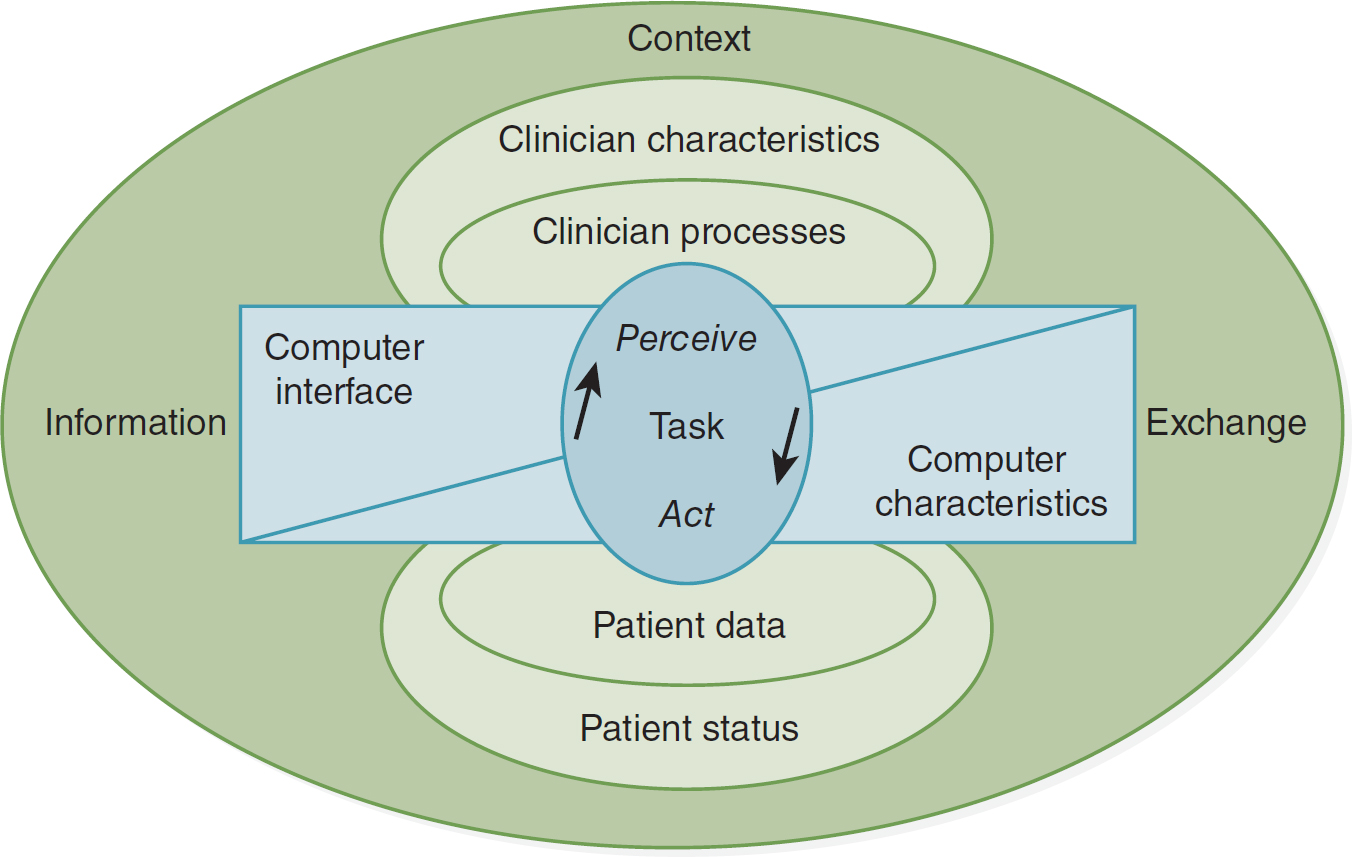
An illustration depicts a framework of nurse-patient interaction supported by technology.
A central circle is labeled perceive, task, act, with an up arrow on the left and a down arrow on the right. A divided box covering the central circle includes a computer interface on the left and computer characteristics on the right. Two circles above the box represent clinician processes and clinician characteristics, while two circles below the box represent patient data and patient status. A larger circle covering the entire illustration includes information on the left, exchange on the right, and context on the top.
Modified from: Staggers, N., & Parks, P. L. (1993). Description and initial applications of the Staggers & Parks nurse-computer interaction framework. Computers in Nursing, 11, 282-290. Reprinted by permission of AMIA.
Usability is a term that denotes the ease with which people can use an interface to achieve a particular goal. Usability of a new human-technology interface needs to be evaluated early and often throughout its development. Typical usability indicators include ease of use, ease of learning, satisfaction with using, efficiency of use, error tolerance, and fit of the system to the task (Staggers, 2003). Some of the more commonly used approaches to usability evaluation are discussed next.
Surveys of Potential or Actual Users
Chernecky et al. (2006) assessed cancer patients' preferences for website design. Participants were asked their preferences for a number of design characteristics, such as display color, menu buttons, text, photo size, icon metaphor, and layout, by selecting on a computer screen their preferences for each item from two or three options.
Focus Groups
Typically used at the very start of the design process, focus groups can help the designer better understand users' responses to potential interface designs and to content that might be included in the interface.
Cognitive Walkthrough
In a cognitive walkthrough, evaluators assess a paper mock-up, working prototype, or completed interface by observing the steps users are likely to take to use the interface to accomplish typical tasks. This analysis helps designers determine how understandable and easy to learn the interface is likely to be for these users and their typical tasks (Wharton et al., 1994).
Heuristic Evaluation
A heuristic evaluation has become the most popular of what are called discount usability evaluation methods. The objective of a heuristic evaluation is to detect problems early in the design process, when they can be most easily and economically corrected. The methods are called discount because they typically are easy to do, involve fewer than 10 experts (often experts in relevant fields, such as human-computer technology or cognitive engineering), and are much less expensive than other methods. They are called heuristic because evaluators assess the degree to which the design complies with recognized usability rules of thumb or principles (the heuristics), such as those proposed by Nielsen (1994) and available on his website (www.useit.com/papers/heuristic/heuristic_list.html).
For example, McDaniel and colleagues (2002) conducted a usability test of an interactive computer-based program to encourage smoking cessation by low-income women. As part of the initial evaluation, healthcare professionals familiar with the intended users reviewed the design and layout of the program. The usability test revealed several problems with the decision rules used to tailor content to users, which were corrected before implementation.
Formal Usability Test
Formal usability tests typically use either experimental or observational studies of actual users using the interface to accomplish real-world tasks. A number of researchers use these methods. For example, Staggers et al. (2007) conducted a usability study of a prototype electronic medication administration record. Participants were asked to add, modify, or discontinue medications using the system. The time they needed to complete the task and their accuracy in the task and satisfaction with the prototype were assessed (the last criterion through a questionnaire). Although satisfaction was high, the evaluation also revealed design flaws that could be corrected before implementation.
Field Study
In a field study, end users evaluate a prototype in the actual work setting just before its general release. For example, Thompson et al. (2007) evaluated the use of touch-screen computer kiosks containing child health-promoting information in several low-income urban community settings through an online questionnaire that could be completed after the kiosk was used. Most users found the kiosk easy to use and the information it provided easy to understand. Researchers also gained a better understanding of the characteristics of the likely users (e.g., 26% had never used the internet, and 48% had less than a high school education) and the information most often accessed (i.e., television and media use and smoke exposure).
Dykes and her colleagues (2006) used a field test to investigate the feasibility of using digital pen and paper technology to record vital signs as a way to bridge an organization from paper to an EHR. In general, satisfaction with the tool increased with use, and the devices conformed well to nurses' workflow. However, 8% of the vital sign entries were recorded inaccurately because of inaccurate handwriting recognition, entries outside the recording box, or inaccurate data entry (i.e., the data entered were not valid values). The number of modifications needed in the tool and the time that would be required to make those changes ruled out using the digital pen and paper as a bridging technology.
Ideally, every healthcare setting would have a usability laboratory of its own to test new software and technology in its own setting before actual implementation. However, having such a laboratory can be expensive, especially for small organizations. Kushniruk and Borycki (2006) developed a low-cost, rapid usability engineering method for creating a portable usability laboratory, consisting of video cameras and other technology, which can be taken out of the laboratory into hospitals and other locations to test the technology on-site using as close to a real-world environment as possible. An on-site usability laboratory is a cost-effective and efficient solution, which makes it possible to test all technologies before their implementation.
Increased attention to improving the human-technology interface through human factors approaches has already led to significant improvements in one area of health care: anesthesiology. Anesthesia machines that once had hoses that would fit into any delivery port now have hoses that can be plugged in to only the proper port. Anesthesiologists have also been actively working with engineers to improve the computer interface through which they monitor their patients' status and are among the leaders in investigating the use of audio techniques as an alternative way to help anesthesiologists maintain their situational awareness. As a result of these efforts, anesthesia-related deaths dropped from 2 in 20,000 to 1 in 200,000 in less than 10 years (Vicente, 2004). It is hoped that continued emphasis on human factors (Vicente, 2004) and user-centered design (Rubin, 1994) by informatics professionals and human-computer interactions experts will have equally successful effects on other parts of the healthcare system. The increased amount of informatics research in this area is encouraging, but there is a long way to go.
A systematic review of clinical technology design evaluation studies (Alexander & Staggers, 2009) found 50 nursing studies. Of those studies, nearly half (24) evaluated effectiveness, fewer (16) evaluated satisfaction, and still fewer (10) evaluated efficiency. The evaluations were not systematic; that is, there was no attempt to evaluate the same system in different environments or with different users. Most evaluations were done in a laboratory rather than in the setting where the system would be used. The authors argued for a broader range of studies that use an expanded set of outcome measures. For example, instead of looking at user satisfaction, evaluators should dig deeper into the design factors that led to the satisfaction or dissatisfaction. In addition, performance measures, such as diagnostic accuracy, errors, and correct treatment, should be used.
Barth (2013) reported on a social study of the human cloud formed in part by data collected from wearable technologies; they focused on assessing attitudes and exploring how cloud computing is enabling this new generation of smart devices. Today, smartphones, glasses, clothing, watches, cameras, and monitors for health or patient tracking, to name but a few devices, are available for this purpose.
Wearable technology, or the field of mobile smart devices that are worn on our bodies, is the current rapidly evolving human-technology interface. Booth (2019) stated that “[r]oughly 60 million Americans use wearable devices” (para. 1), which include gloves, body gear, and headsets. Booth reported that for the most part, wearables consist of shrinking smartphone technology-for example, taking the smartphone's display and adding it to a watch. However, the next new frontier is creating wearable devices that not “only read signals from the human body but also intersect and interject signals into the human body” (para. 5). Marr (2020) stated that this industry began with fitness trackers and has “now exploded into a whole industry of wearable technology designed to improve human performance and help us live healthier, safer, more efficient lives. In the future, we may even see humans merge with technology to create ‘augmented humans' or ‘transhumans'” (para. 4). With these developments, it will be critical for the human-technology interfaces to accommodate the needs of varied users with numerous personal and healthcare needs and lifestyles.
The technologies that are entering our lives on a daily basis can enhance or challenge our ability to complete both our activities of daily living and our professional tasks. As our home monitoring and patient technologies increase, the user's (i.e., patient's or nurse's) ability to use the technology is paramount. No matter who is using the technology, the human-technology interface addresses the user's ability and the technology's functionality to complete the task's demands (see Figure 11-4).
Figure 11-4 Human-Technology Interface and Task Completion
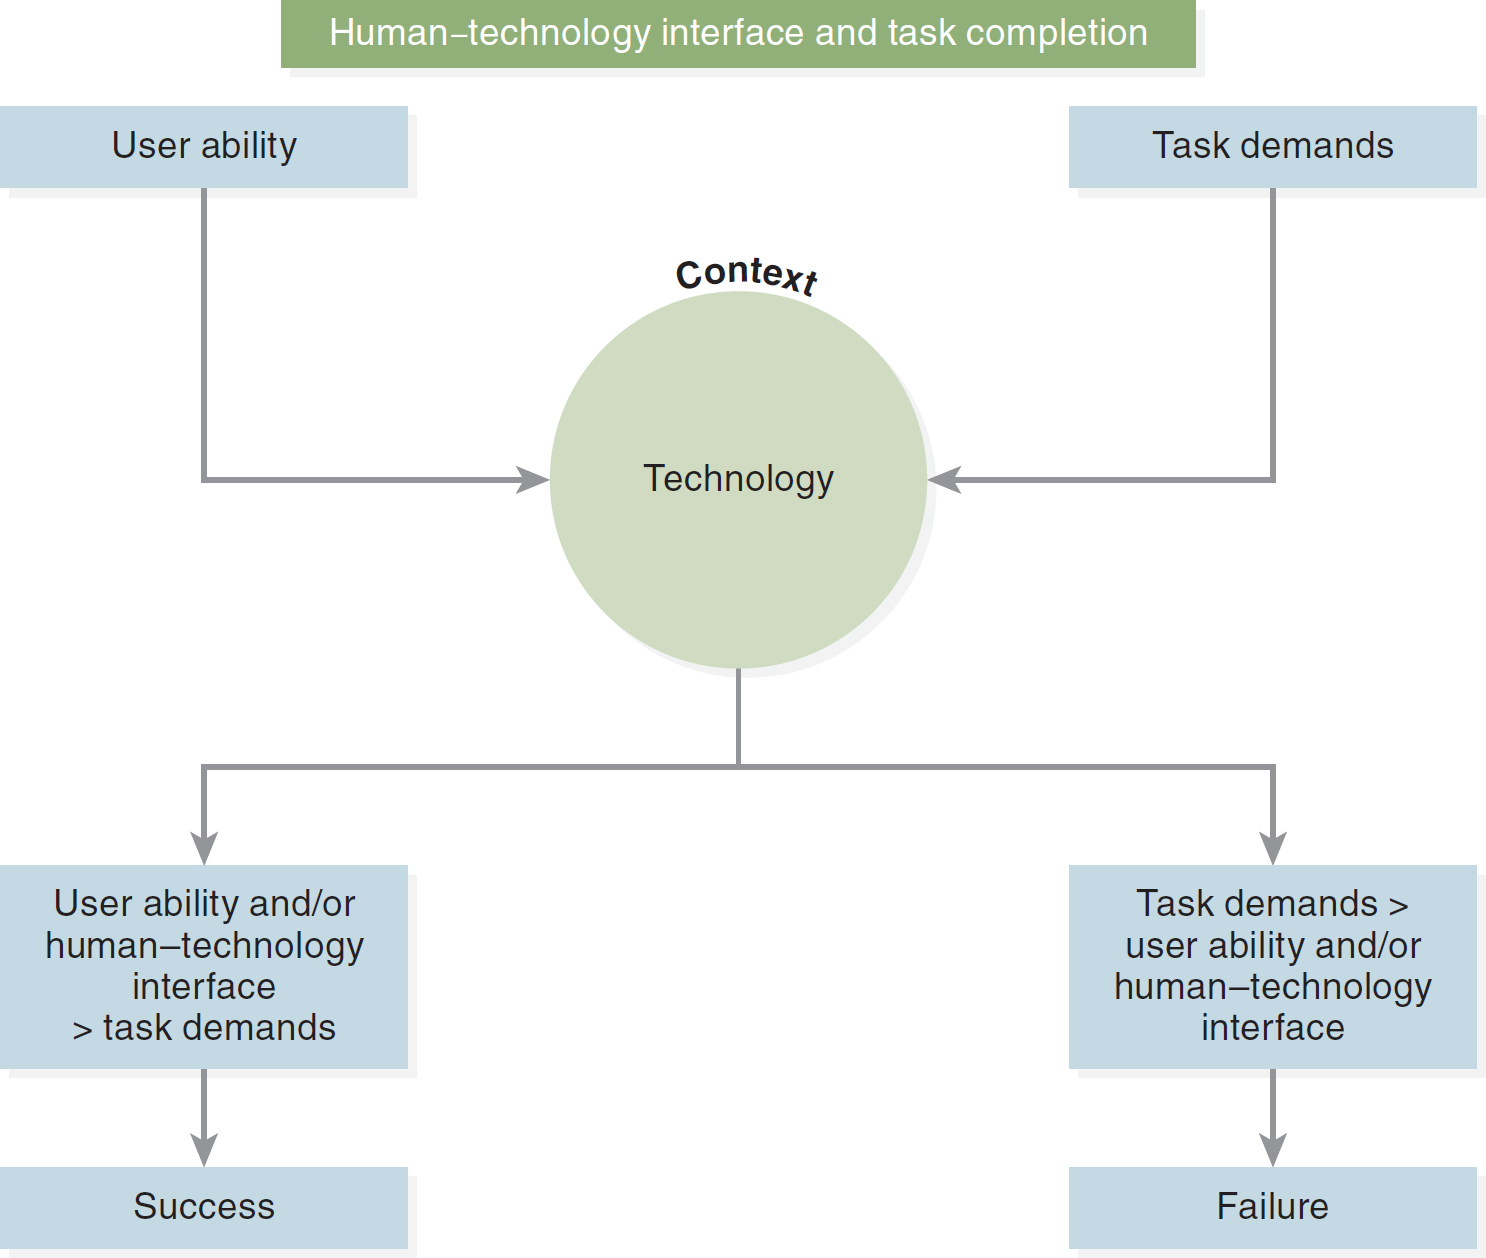
A flow diagram depicts the interaction between the human-technology interface and task completion.
The flow begins with user ability and task demands, converging into the context of technology. The technology then branches into two paths: 1. User ability and, or human-technology interface less than task demands, leading to success. 2. Task demands surpassing user ability and, or human-technology interface, resulting in failure.
As our technologies continue to evolve, we are creating more design issues. The proliferation of smart devices and wearable technology brings new concerns related to human-technology interfaces. According to Ferreira et al. (2021), wearable technologies are adding another wrinkle into the design process-namely, human behavior. How will someone use this technology? How will individuals behave with it on their person? How will they wear it? How and when will they enable and use it? Will others be able to detect the technologies (i.e., will someone be able to wear Google Glass and take pictures or videos of other people's actions without their knowing), and will users be able to seamlessly move among all the capabilities of their wearable technologies? We have a long way to go in addressing these issues.
Futurside (2022) reported that the future of “human-computer interfaces is increasingly complex and dynamic, as organizations continue to look for ways to increase efficiency” (para. 14). We are learning how to interact with the new technology, and it is the “wild west when it comes to voice, VR and wearables, but these technologies aren't going anywhere. In fact, they are laying the foundation for a future where humans and computers are tied more closely together than ever before” (Bieller, 2022, para. 32). Bechtel (n.d.) believed “[t]he ‘Age of With'-human work augmented and enhanced with AI-is upon us. How will rapidly evolving artificial intelligence technology shape the future of how we live and work?” (para. 1). We will continue to experience major advances and influences that are impacting our machine interactions, human-technology interfacing, especially when you consider how fast AI text and image generators exploded into our awareness and affected our personal and professional lives. “AI is neither hero nor villain. Rather, it represents our species' latest in a long series of hacks: This time, offloading discernment and decision-making” (Bechtel, n.d., para. 24). As new technologies disrupt, it is up to us to learn, leverage, harness, and control their effect and the human-technology interface.