Objectives ⬇
- Describe big data.
- Appreciate the effect of artificial intelligence on knowledge discovery in clinical data.
- Explore the contributions of data mining, computational biology, and bioinformatics.
- Compare data analytics models.
Key Terms ⬆ ⬇
Introduction: Big Data, Data Mining, and Knowledge Discovery ⬆ ⬇
The digital revolution in health care brought on by the shift to electronic health records (EHRs), interoperability initiatives, and increasingly sophisticated technology tools has led to the generation of large amounts of healthcare data. Although these data can seem overwhelming at times, they afford the opportunity to leverage data mining tools to convert them into actionable knowledge. Data mining methods have been developed over time using research. As data mining evolves, healthcare organizations have not only become able to navigate their data in real time but also have progressed beyond mere access to retrospective data to navigational improvements that allow them to learn much from their data. Using data mining techniques on data stored in an enterprise data warehouse, administrators could, for example, answer the question, “What was the most commonly diagnosed disease in our nine-hospital system last April?” They could then drill down to one hospital. As big data collection capabilities, data capture, data transmission, storage capabilities, powerful computers, statistics, artificial intelligence (AI), high-functioning relational database engines with data integration, and advanced algorithms developed, the ability to data mine big data to predict and deliver prospective and proactive information has been realized. By answering a question such as “What is likely to be the most commonly diagnosed disease next month and why?” predictions can be made. These actionable insights might then be used to inform professional recruitment or staffing strategies for the healthcare system. Data mining includes tools for visualizing relationships in the data and mechanizes the process of discovering predictive information in massive databases.
Pattern discovery entails much more than simply retrieving data to answer an end user's query. Data mining tools scan databases and identify previously hidden patterns. The predictive, proactive information resulting from data mining analytics then assists with development of business intelligence, especially in relation to how an enterprise can be improved.
Building intelligence or knowledge is key; therefore, in 2013 the National Institutes of Health (NIH) Big Data to Knowledge (BD2K) initiative was launched to support the research and development of innovative and transformative approaches and tools to maximize and hasten the integration of big data and data science into biomedical research. The BD2K initiative supports initial efforts toward making data sets FAIR: findable, accessible, interoperable, and reusable. Although the BD2K program has concluded, it was responsible for advancing data sciences by individual training and the development of data analytics education resources, software, and data indices (NIH, 2021).
In response to the COVID-19 pandemic, the White House Office of Science and Technology Policy (2020) requested the development of an open-access machine-readable research data set. The COVID-19 Open Research Dataset (CORD-19) is a collection of coronavirus literature formed as a result of the efforts of several groups, including a commercial software vendor, a university, an AI institute, the NIH, and the National Library of Medicine. “The White House joins these institutions in issuing a call to action to the Nation's artificial intelligence experts to develop new text and data mining techniques that can help the science community answer high-priority scientific questions related to COVID-19” (para. 3). This database provided a tremendous opportunity for scientific researchers to mine this valuable data, discover new insights, collaborate on strategies for addressing this pandemic, and prepare for and predict future pandemics.
Much of our big data are unstructured data; unstructured big data reside in text files, which represent more than 75% of an organization's data. Such data are not always contained in databases and can easily be overlooked; moreover, trends and patterns are difficult to discern in such data. Data mining is an iterative process that explores and models big data to identify patterns and provide meaningful insights. As the tools evolve with which data and information can be collected, accessed, and processed, it is necessary to concomitantly evolve how the data and information are analyzed and interpreted.
A website article (Taylor, 2023) described big data as a collection of data that is huge in size and yet growing exponentially with time. In short, such a collection of data is so large and complex that none of the traditional data management tools are able to store it or process it efficiently (para. 2). Big data are generated every day from trades on the stock exchange; social media posts; graphics; videos; photographs; digital X-rays; cell phones; and even jet engines, which can generate millions of data points during each flight. Consider the amount of data generated from patient information gathered in a practice, all practices in any community, and all practices across any country. It is hard to even imagine how much data are processed.
Data mining is the process of using software to sort through data to discover patterns and ascertain relationships. This process may help to discover previously unidentified relationships among the data in a database with a focus on applications. This information can then be used to increase profits or decrease costs or both. In health care, data mining is being used to improve efficiency and quality, which results in better healthcare practices and improved patient outcomes.
As healthcare professionals' analytical skills are honed, they will be able to clarify and explain patterns in healthcare big data related to improved patient responses to select treatments for optimal patient outcomes. They can then drill down for each treatment to examine the conditions patients presented with and the number of visits they made. The data can then be explored to refine the output. For example, it would be very important to know more about patients, such as whether they had other conditions or diseases (i.e., comorbidities), as well as their age, gender, and educational level, which could affect their outcomes. Zarrinpar et al. (2019) have identified EHR big data research as comparative effectiveness research used to explore the effectiveness of treatment approaches. “The patient populations are very large and more representative of actual practice; the comparators are active and variable; outcome measures are patient centered or global; follow-up time is long; cost is low, especially per patient; and the speed is fast” (p. 602).
Data mining projects help organizations discover interesting knowledge. These projects can be predictive, exploratory, or focused on data reduction. Data mining focuses on producing a solution that generates useful forecasting through a four-phase process: (1) problem identification; (2) exploration of the data; (3) pattern discovery; and (4) knowledge deployment, or application of knowledge to new data to generate predictions. Data mining is an analytical, logical process with the ultimate goal of forecasting. It unearths concealed predictive information to help construct a picture of the data that lends insight into future trends, actions, or behaviors. This data exploration and resulting knowledge discovery foster proactive, knowledge-driven decision-making. See Figure 22-1, which illustrates how raw data are transformed into knowledge through an iterative and interactive process.
Figure 22-1 Transforming Raw Data into Knowledge through an Iterative and Interactive Process
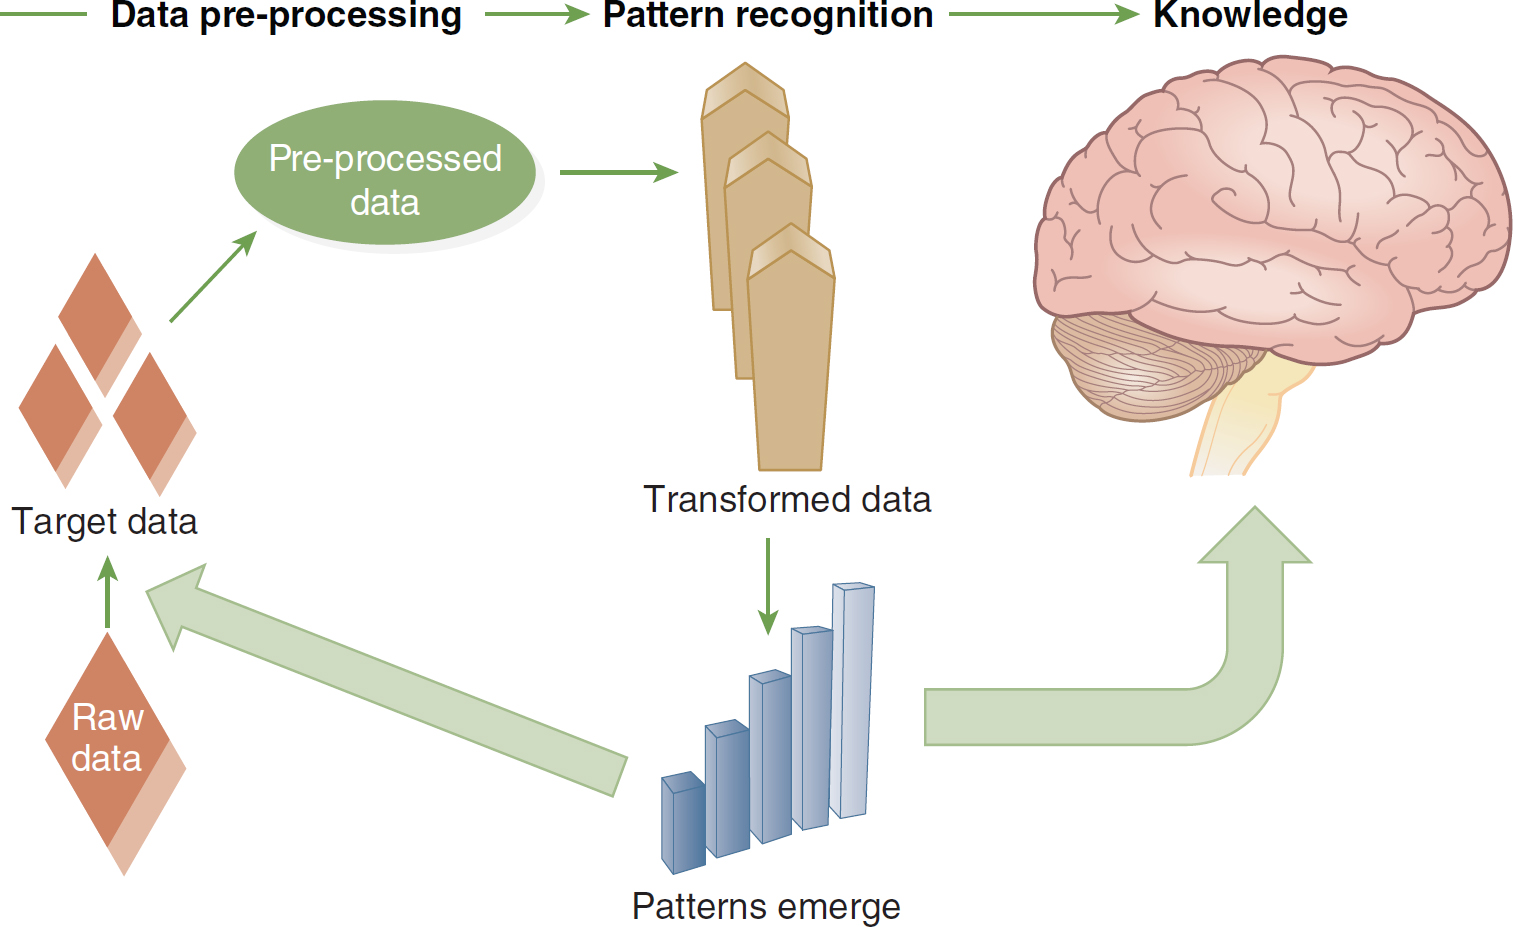
An illustration depicts the transformation of raw data into knowledge through a series of stages.
During the data pre-processing stage, the raw data, portrayed as a diamond, goes through a conversion process into target data, symbolized by three smaller diamonds. This transformation culminates in pre-processed data. In the pattern recognition phase, the transformed data exposes emerging patterns, represented by a series of ascending bars. Ultimately, this progression results in the acquisition of knowledge, as depicted by an illustration of the brain.
Image created by Dr. Dee McGonigle.
The steps in the data mining process have been variously described. We outline some of the key components of the process here.
Problem identification is the initial phase of data mining. The problem must be defined, and everyone involved must understand the objectives and requirements of the data mining process they are initiating.
Exploration begins with exploring and preparing the data for the data mining process. This phase might include data access, cleansing, sampling, and transformation; based on the problem to be solved, data might need to be transformed into another format. To assure meaningful data mining outcomes, the data must truly be comprehended. The goal of this phase is to identify the relevant variables and determine their nature.
Data are mined using models. According to Microsoft (2022), mining models are generated when “an algorithm [is applied] to data, but it is more than an algorithm or a metadata container: it is a set of data, statistics, and patterns that can be applied to new data to generate predictions and make inferences about relationships” (para. 1). It is important to consider the data mining structure and the model as two discrete objects. The data mining model remains empty until the data from the data mining structure have been processed and examined. The data mining structure stores information that defines the data source. The data mining model stores information that results from the statistical processing of the data, such as patterns arising from the examination or analysis. After a data mining model has been processed, it will contain metadata; outcomes; and bindings, or links back to the data mining structure.
Sometimes known as model building or pattern identification, pattern discovery is a complex phase of data mining. In this phase, different models are applied to the same data to choose the best model for the data set being analyzed. It is imperative that the model chosen should identify the patterns in the data that will support the best predictions. The model must be tested, evaluated, and interpreted. Therefore, this phase ends with a highly predictive, consistent pattern-identifying model.
The final phase, knowledge deployment, takes the pattern and model identified in the pattern discovery phase and applies them to new data to test whether they can achieve the desired outcome. In this phase, the model achieves insight by following the rules of a decision tree to generate predictions or estimates of the expected outcome. This deployment provides the organization with the actionable information and knowledge necessary to make strategic decisions in uncertain situations.
Data mining develops a model that uses an algorithm to act on data sets for one situation where the organization knows the outcome and then applies this same model to another situation where the outcome is not known-an extension known as scoring. Data mining is concerned with extracting what is needed. It applies statistics so that organizations can gain an advantage by manipulating information for practical applications. In the information-overloaded healthcare world, all too often health practitioners find themselves grasping for knowledge that is currently nonexistent or fleeting. Data mining is a dynamic, iterative process that is adjusted as new information surfaces. It is a robust, predictive, proactive information and knowledge tool that, when used correctly, empowers organizations to predict and react to specific characteristics of and behaviors within their systems.
Data mining is also known as knowledge discovery and data mining (KDD), knowledge discovery in data, and knowledge discovery in databases. The term knowledge discovery is key because data mining looks at data from different vantage points, aspects, and perspectives and brings new insights to the data set. This analysis sorts and categorizes the data and then summarizes the relationships identified. In essence, data mining is the process of finding correlations or patterns among the data.
Health care, as noted earlier, generates big data. In turn, data mining tools are able to analyze enormous databases to determine patterns and establish applications to new data. Healthcare organizations clearly need to invest more in big data and data mining analysis if they are to have an effect on clinical outcomes and population health. Vennaro (2017) lamented the shortage of health informaticists:
There are currently fewer than 15,000 formally trained medical informaticists in the U.S., with demand increasing up to 70,000 in the next five years [2022]. This creates a huge talent gap, where healthcare organizations lack the clinical expertise required to make data effective. Without informaticists to bridge the business and clinical aspects of data, it will be difficult for organizations to ask the right questions, let alone getting to the right actions and conclusions. (para. 6)
The healthcare sector has discovered data mining through the realization that knowledge discovery can help to improve healthcare policy making and practices, disease prevention, detection of disease outbreaks, prevention of sequelae, and prevention of in-hospital deaths. On the business side, healthcare organizations use data mining for the detection of fraudulent insurance claims. According to Kumaraswamy et al. (2022),
Healthcare fraud is an expensive, white-collar crime in the United States, and it is not a victimless crime. Costs associated with fraud are passed on to the population in the form of increased premiums or serious harm to beneficiaries. There is an intense need for digital healthcare fraud detection systems to evolve in combating this societal threat. (para. 1)
If organizations are to develop a successful data mining process, they must have specially trained data analysts (also called biomedical informaticists) and access to the data needed to create meaningful information. In general, there are three main types of data analytics, each with a different objective: descriptive analytics to gain information on what has occurred, predictive analytics to suggest what might occur, and prescriptive analytics to suggest a course of action (University of Pittsburgh, 2021).
In health care, the ability to analyze the data by making sure that those data are comprehensive and complete, meeting current needs, and cleansed and prepared for the data mining process is being honed. Many facilities are using data warehouses to store data and facilitate this pre-data mining process. In addition, healthcare systems are increasingly sharing data to build robust databases and to share best practices. Nurses are learning to ask the right questions during the data mining process to gain a thorough understanding of their data. The following pages introduce the concepts, techniques, and models used in data mining.
Knowledge Discovery and Data Mining and Research ⬆ ⬇
Data mining for knowledge discovery is not new; it has been used for several decades in research. Over the past several decades, the KDD capability has improved as the analytical power of data mining tools has increased, thereby facilitating the recognition of patterns and relationships in big data. Berger and Berger (2004) have suggested that nurse researchers are positioned to use data mining technologies to transform the repositories of big data into comprehensible knowledge that will be useful for guiding nursing practice and facilitating interdisciplinary research.
Knowledge discovery capabilities continue to evolve because of the availability of advanced analytical software that is designed to facilitate data mining. Early examples of data mining in research include Goodwin et al. (1997), who explored the relationship between clinical data and adult respiratory distress syndrome (ARDS) in critically ill patients. Madigan and Curet (2006) described the classification and regression tree (CART) data mining method for analyzing the outcomes and service use in home health care for three conditions, chronic obstructive pulmonary disease, heart failure, and hip replacement. They found that four factors-patient age, type of agency, type of payment, and ethnicity-influenced discharge destination and length of stay. Trangenstein et al. (2007) described how faculty members used data mining to analyze their students' clinical logs, which enabled them to make programmatic decisions and revisions and rethink certain clinical placements. Fernández-Llatas et al. (2011) described workflow mining technology as a means to facilitate relearning in dementia processes. Lee et al. (2011) discussed the application of data mining to identify critical factors such as nursing interventions related to patient fall outcomes. Lee et al. (2012) used data mining to determine risk factors related to each stage of pressure ulcers and identified five predictive factors: hemoglobin level, weight, sex, height, and use of a repositioning sheet. Based on the results of this data mining analysis, nurses can better target their interventions to prevent pressure ulcers. Green et al. (2013) identified differences in limb volume patterns in breast cancer survivors; their results have the potential to influence clinical guidelines for the assessment of latent and early-onset lymphedema.
More recent data mining research reports highlight the versatility of clinical problem-solving afforded by data mining. Li et al. (2019) explored factors that predict pressure injuries for patients at the end of life; De Gagne et al. (2019) mined Twitter data to uncover cyberincivility between nurses and students; Thorlton and Catlin (2019) mined data to uncover adverse drug events; Härkänen et al. (2020) studied staffing and medication errors; Jin (2022) used data mining to predict risks in obstetric nursing; and Chen (2021) described data mining techniques for optimizing a nursing management system. Interprofessional collaboration and its effects on patient outcomes is also receiving more attention in the research literature. Conca et al. (2018) described a process mining approach to examine collaborations within the care team in the treatment of patients with type 2 diabetes.
As these research examples suggest, data mining is a powerful tool with nearly endless possibilities for informing and supporting clinical transformations using data-driven models of care and examining interprofessional collaboration to reduce inefficiencies, control costs, and improve quality.
| Case Study |
|---|
| In a large teaching hospital, patients with congestive heart failure (CHF) who are being treated at the facility have a high rate of readmission. The chief nursing officer (CNO) wants to know the cause of the readmissions because the rate at this facility is almost twice that of competing healthcare entities in the area. The CNO works with the nursing researchers at the university to address this situation.
The researchers begin to scour the EHRs of more than 15,000 CHF hospitalizations in the past 4 years to determine the cause of the situation. As they begin to understand this data set, they are able to build a data mining model using algorithms to discover patterns and relationships in the data. Based on the old data, they determine that the key factor for readmission was the length of time it took to follow up at home with discharged patients.
In response to this new knowledge, a program is developed in which nurses telephone patients with CHF the day after their discharge, and a home visit is scheduled for the second day post discharge to ensure a smooth transition to home or an assisted living facility. The follow-up within the first 4 days of discharge has reduced readmissions by 40%. The model that was used with the old data is being applied to the new data.
|
| Case Study: 23andMe |
|---|
| One of the largest genetic studies of our time could be 23andMe. According to Molteni (2018), “Since the launch of its DNA testing service in 2007, genomics giant 23andMe has convinced more than 5 million people to fill a plastic tube with half a teaspoon of saliva” (para. 1). So what do the customers receive? Molteni stated that “[i]n return for all that spit (and some cash too), customers get insights into their biological inheritance, from the superficial-do you have dry earwax or wet?-to mutations associated with disease” (para. 1). “What 23andMe gets is an ever-expanding supply of valuable behavioral, health, and genetic information from the 80 percent of its customers who consent to having their data used for research” (para. 1). Therefore, this company captures and gains access to big data that it can mine. It can also sell the mining rights: “[O]ne of the world's biggest drugmakers, GlaxoSmithKline, is gaining exclusive rights to mine 23andMe's customer data for drug targets” (para. 1). It will have “four years of exclusive rights to run analyses to discover new drug targets” (para. 2). Reflecting on this information, what effect could businesses have on the healthcare market if they can leverage big data from patients and consumers?
Molteni, M. (2018). 23andMe's pharma deals have been the plan all along. Wired. www.wired.com/story/23andme-glaxosmithkline-pharma-deal
|
Businesses have also gathered healthcare data. In some cases, the big data that they garner is used to leverage more investments into their companies. One example is 23andMe. Think about the capture and sale of big data mining rights while you refer to the 23andMe case study.
Data Mining Concepts ⬆ ⬇
Bagging is the term that describes the use of voting and averaging in predictive data mining to synthesize the predictions from many models or methods or the use of the same type of model on different data. This term can also refer to the unpredictability of results when complex models are used to mine small data sets.
Boosting is what the term infers-a means of increasing the power of the models generated by weighting the combinations of predictions from those models into a predicted classification. This iterative process uses voting or averaging to combine the different classifiers.
Data reduction shrinks large data sets into manageable, smaller data sets. One way to accomplish this is via aggregation of the data, or clustering.
Typically, drill down analysis begins by identifying variables of interest to drill down into the data. Nurses could identify a diagnosis and then drill down, for example, to determine the ages of those diagnosed or the number of males. They could then continue to drill down and expose even more of the data.
Exploratory data analysis (EDA) is an approach that uses mainly graphical techniques to gain insight into a data set. Its goal varies based on the purpose of the analysis, but it can be applied to the data set to extract variables, detect outliers, or identify patterns.
Feature selection reduces inputs to a manageable size for processing and analysis whereby the model either chooses or rejects an attribute based on its usefulness for analysis.
Machine learning is a subset of AI that permits computers to learn either inductively or deductively. Inductive machine learning is the process of reasoning and making generalizations or extracting patterns and rules from huge data sets-that is, reasoning from a large number of examples to a general rule. Deductive machine learning moves from premises that are assumed true to conclusions that must be true if the premises are true.
Meta-learning combines the predictions from several models. It is helpful when several models are used in the same project. The predictions from the different classifiers can be included as input into the meta-learning. The goal is to synthesize these predicted classifications to generate a final, best-predicted classification, which is a process also referred to as stacking.
Predictive data mining identifies the data mining project as one with the goal of identifying a model that can predict classifications.
Stacking or stacked generalization synthesizes the predictions from several models.
Data Mining Techniques ⬆ ⬇
Many data mining projects are implemented as part of a team, with each member bringing important skill sets to the mix. For example, there may be a chief nursing informatics officer, a nurse informaticist, a statistician, and an information technology specialist. It is also important to identify the project goals and to choose the best technique to get the most from the data mining. As Simpson (2019) pointed out, “[o]ne of the most crucial skills for nursing's big data scientists will be the ability to frame questions specifically in order to derive not just a high-value answer but the insights that go with it” (p. 378). Following is an overview of the commonly used techniques in data mining neural networks, decision trees, rule induction, algorithms, and the nearest neighbor method.
Neural networks represent nonlinear predictive models. These models learn through training and resemble the structure of biological neural networks; that is, they model the neural behavior of the human brain. Computers are fast and can respond to instructions repeatedly. Humans use their experiences to make generalizations about the world around them. Neural networks are a way to bridge the gap between computers and humans, and they go through a learning process on existing data so that they can predict, recognize patterns, or classify data.
A decision tree is so named because the sets of decisions form a tree-shaped structure. The decisions generate rules for classifying a data set. CART and chi-square automatic interaction detection (CHAID) are two commonly used types of decision tree methodologies. See Box 22-1 and Figure 22-2 for an overview of decision tree analysis.
Figure 22-2 Decision Tree Analysis Output
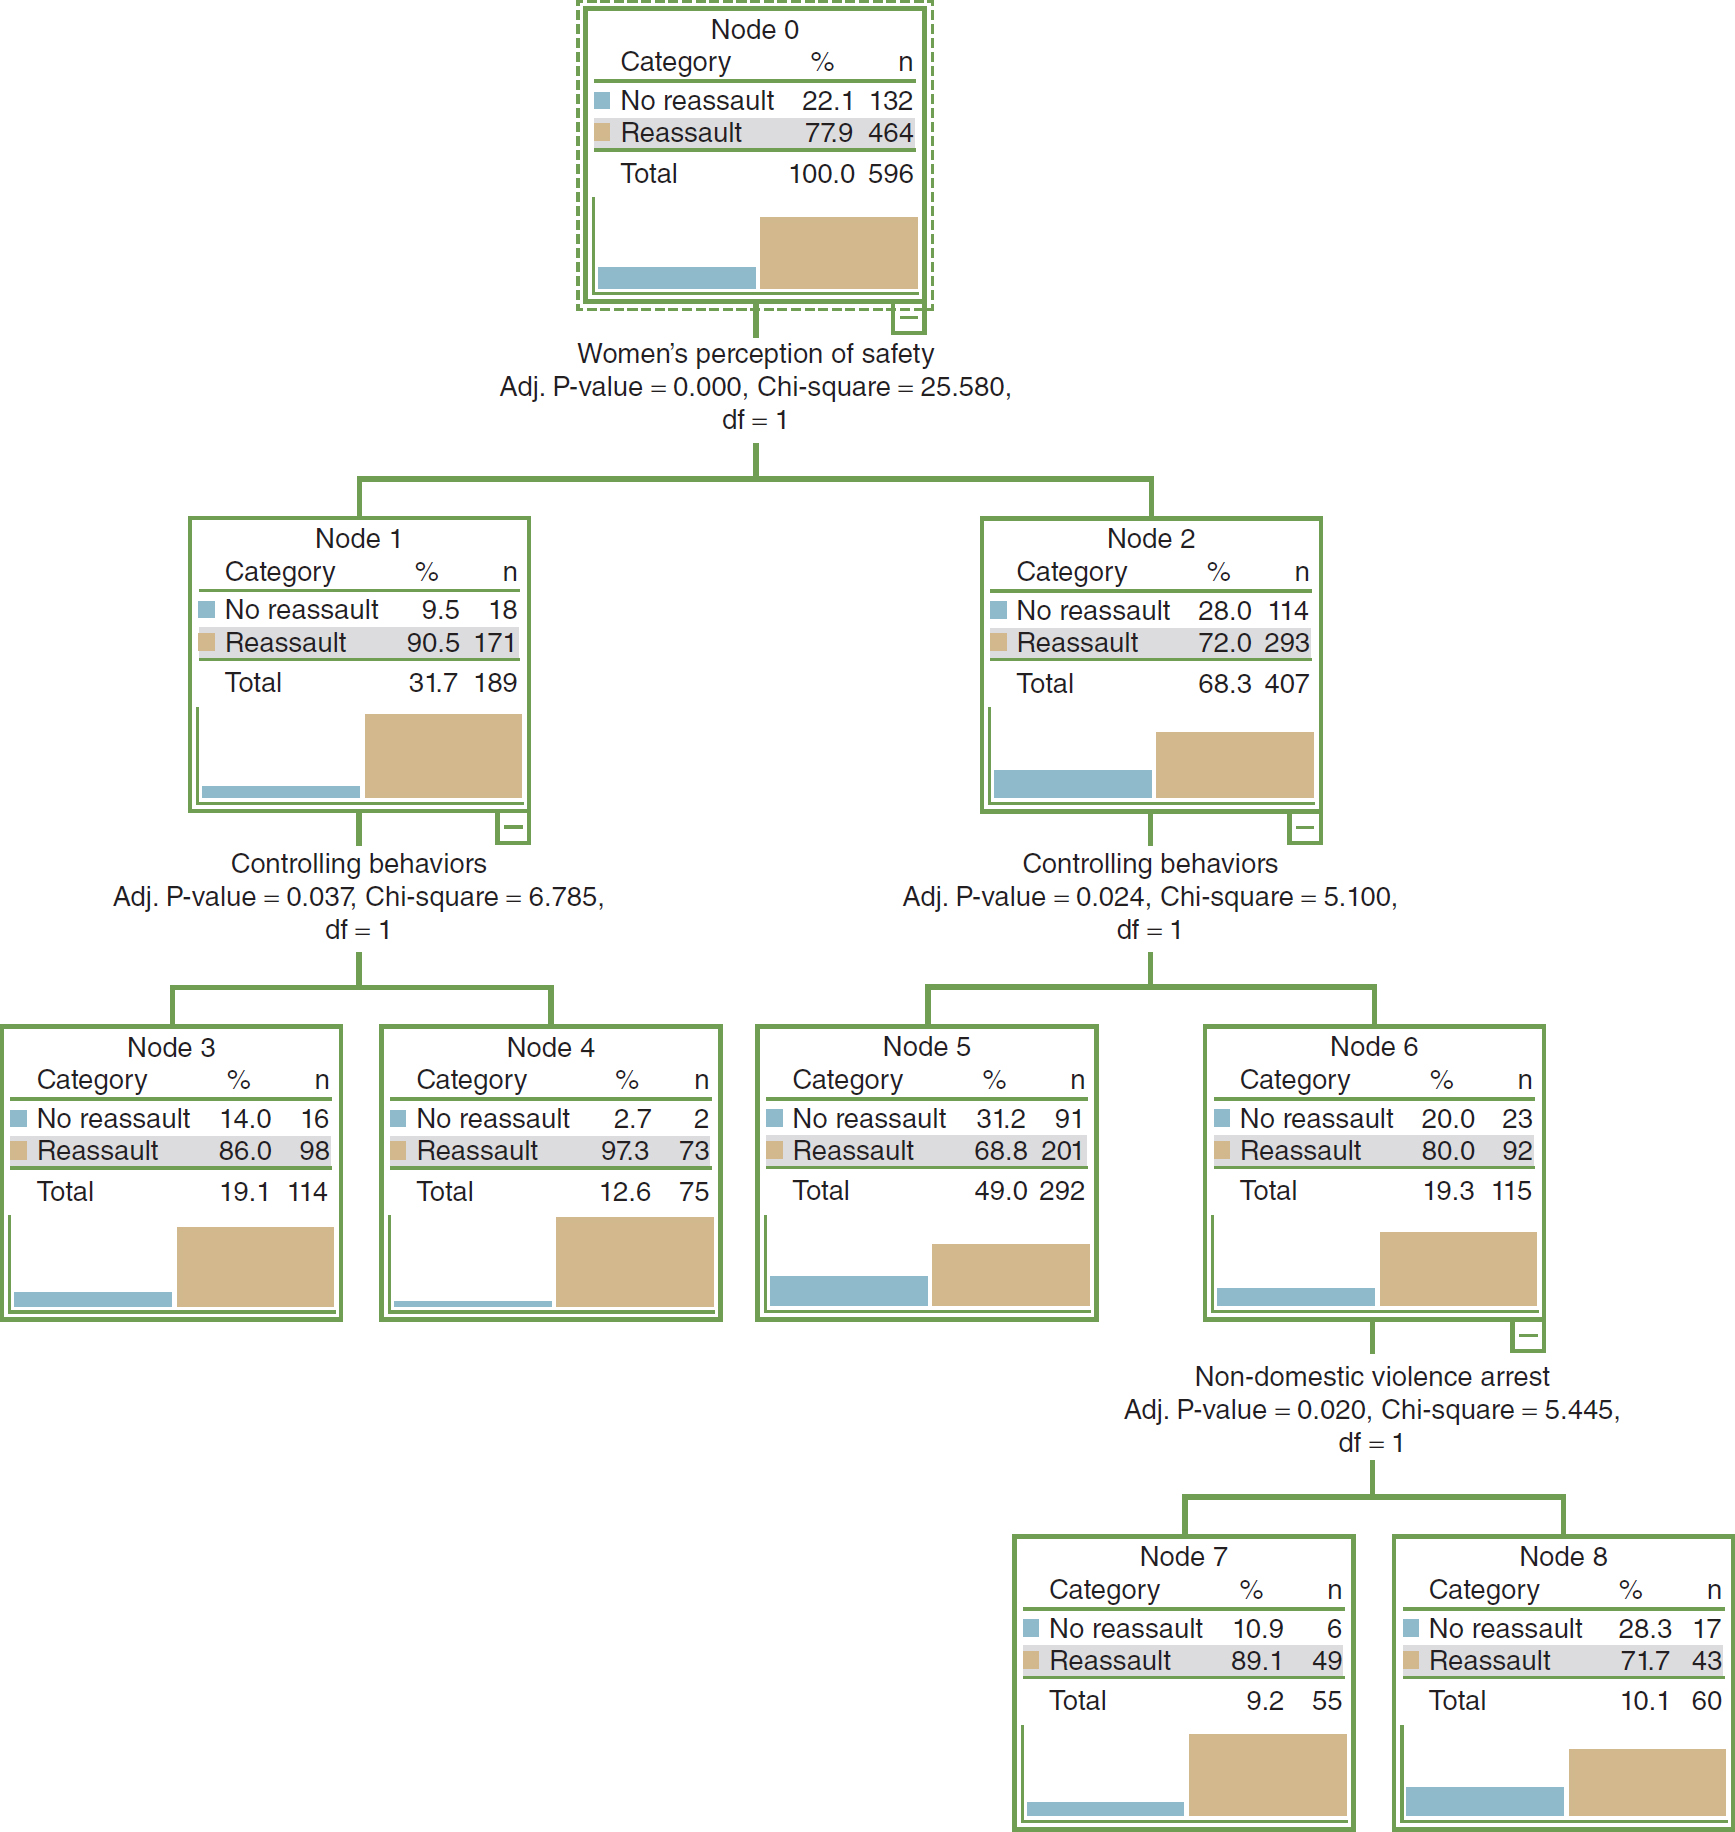
A flowchart depicts the output of decision tree analysis.
The flowchart comprises four levels, from top to bottom. Level 1 comprises Node 0. Node 0 displays three columns: Category, percentage, and n. The row entries are as follows. No reassault: 22.1; 132. Reassault: 77.9; 464. Total: 100.0; 596. Level 2 consists of Node 1 and Node 2 branching from Node 0. Women's perception of safety: Adjusted P-value equals 0.000, Chi-square equals 25.580, degrees of freedom equals 1. Node 1 displays three columns: Category, percentage, and n. The row entries are as follows. No reassault: 9.5; 18. Reassault: 90.5; 171. Total: 31.7; 189. Node 2 displays three columns: Category, percentage, and n. The row entries are as follows. No reassault: 28.0; 114. Reassault: 72.0; 293. Total: 68.3; 407. Level 3 consists of Node 3 and Node 4 branching from Node 1; and Node 5 and Node 6 branching from Node 2. Node 3 and 4 are obtained from controlling behaviors: Adjusted P-value equals 0.037, Chi-square equals 6.785, degrees of freedom equals 1. Node 5 and 6 are obtained from controlling behaviors: Adjusted P-value equals 0.024, Chi-square equals 5.100, degrees of freedom equals 1. Node 3 displays three columns: Category, percentage, and n. The row entries are as follows. No reassault: 14.0; 16. Reassault: 86.0; 98. Total: 19.1; 114. Node 4 displays three columns: Category, percentage, and n. The row entries are as follows. No reassault: 2.7; 2. Reassault: 97.3; 73. Total: 12.6; 75. Node 5 displays three columns: Category, percentage, and n. The row entries are as follows. No reassault: 31.2; 91. Reassault: 68.8; 201. Total: 49.0; 292. Node 6 displays three columns: Category, percentage, and n. The row entries are as follows. No reassault: 20.0; 23. Reassault: 80.0; 92. Total: 19.3; 115. Level 4 consists of Node 7 and Node 8 branching from Node 6. Node 7 and 8 are obtained from non-domestic violence arrest: Adjusted P-value equals 0.020, Chi-square equals 5.445, degrees of freedom equals 1. Node 7 displays three columns: Category, percentage, and n. The row entries are as follows. No reassault: 10.9; 6. Reassault: 89.1; 49. Total: 9.2; 55. Node 8 displays three columns: Category, percentage, and n. The row entries are as follows. No reassault: 28.3; 17. Reassault: 71.7; 43. Total: 10.1; 60.
| Box 22-1 Decision Tree Analysis |
|---|
| Steven L. Brewer Jr.
Decision trees are a statistical technique based on using numerous algorithms to predict a dependent variable. These predictions are determined by the influence of independent variables. Decision trees help researchers understand the complex interactions among variables generated from research data. The entire data set is split into child nodes based on the effect of the independent predictors. The most influential variable is situated at the top of the tree; the subsequent nodes are ranked by the significance of the remaining independent predictors.
Graphically, decision trees produce a tree (as illustrated in Figure 22-2), which consists of a root node and child nodes. The tree is an inverted, connected graphic. The graphic representation of the decision tree helps general users, such as practitioners, understand the complex interrelationships between the independent and the dependent variables in a large data set.
Within the graphical display, there are three major components: the root node, the child nodes, and the terminal node. The root node represents the dependent variable, and the child nodes represent the independent variables. The root node is essentially the base of the tree, or the top node. It contains the entire sample, whereas each child node contains a subset of the sample within the node directly above it. In Figure 22-2, the root node represents a sample of women who were either reassaulted or not reassaulted in a domestic violence database. Data in the root node are then partitioned and passed down the tree.
The number of child nodes will vary depending on the classification procedure that is used to determine how the data are split. In Figure 22-2, the first child node is “women's perception of safety.” This node suggests that the most influential predictor in domestic violence reassault for this sample is the women's perception of safety. The tree produces additional child nodes based on the responses to that variable. Node 1 represents the women who responded no when asked whether they felt safe in the relationship. For this node, women had a 90% chance of being reassaulted. In contrast, node 2 represents the women who responded yes when asked whether they felt safe in the relationship. These women had only a 72% chance of being reassaulted.
The decision tree in Figure 22-2 splits the entire sample into subsamples, which in turn allow for different predictions for different groups within the sample. For example, women who felt safe in their relationship (node 2) and experienced controlling behaviors (node 6) had an 80% chance of being reassaulted. In contrast, women who did not feel safe (node 1) and were in a relationship characterized by controlling behaviors (node 4) had a 97.3% chance of being reassaulted. The splitting of the data continues until the data are no longer sufficient to predict the remaining variables or there are no additional cases to be split.
Classification trees share commonalities with nonlinear traditional methods, such as discriminant analysis, cluster analysis, nonparametric statistics, and nonlinear estimation; however, the technique differs significantly from linear analyses. In general, the decision tree technique does not rely on “multiplicative” or “additive” assumptions, such as regression, to predict the outcome of y. The flexibility of classification trees is one characteristic that makes them attractive to researchers. The trees are not limited to examining all predictor variables simultaneously. Therefore, each predictor variable can be examined as a singularity to produce univariate splits in the tree. In addition, classification trees can handle a mixture of categorical and continuous variables when univariate splits are used. Although this flexibility offers advantages over traditional methods, classification trees are not limited to univariate splits.
Decision trees have become a popular alternative to methods such as regression and discriminate analysis for data mining big data. Such trees use algorithms from one of the numerous classification procedures to separate the data into different branches, or child nodes, that predict y. The dependent variable (y) is represented by the root node.
These algorithms have three main functions: (1) They explain how to separate or partition the data at each split, (2) they decree when to stop or end the splitting of data, and (3) they determine how to predict the value of y for each x in a split. The child nodes are separated into homogeneous groups by the algorithms from different classification procedures. This process of partitioning is the main purpose of classification procedures. First, the procedure clusters and creates child nodes. Second, it ranks them based on their predictive values of y. Hence, the most influential variables will be located at the base of the tree. From this point, the classification procedures further expand the child nodes by finding the next best factor. The tree is expanded until the algorithm is unable to find a clearly distinguishable split within the data.
Based on the results of the sample decision tree analysis presented in Figure 22-2, practitioners would conclude that women should be attuned to their perception of safety in a relationship because those who feel unsafe have a much higher chance of being reassaulted.
Decision trees are a powerful tool that can be used to mine large data sets and discover previously unknown relationships among the data. The predictive relationships uncovered by the decision tree analysis may be useful in directing approaches to future care interventions.
|
Rule induction is based on statistical significance. Rules are extracted from the data using if-then statements, which become the rules.
Typically, algorithms are computer-based methods with which data mining models are developed. To create the model, the data set is first analyzed by the algorithm to determine specific patterns and trends. Based on the results of this analysis, the algorithm defines the parameters of the data mining model. The identified parameters are then applied to the entire data set to mine it for patterns and statistics.
Nearest neighbor analysis classifies each record in a data set based on a select number of its nearest neighbors. This technique is also known as the k-nearest neighbor.
Text mining for text is equivalent to data mining for numerical data. Because text is not always consistent in health care, owing to the lack of a generally accepted terminology structure, it is more difficult to analyze. Text documents are analyzed by extracting key words or phrases.
Online analytic processing (OLAP) generates different views of the data in multidimensional databases. These perspectives range from simplistic views, such as descriptive statistics, frequency tables, or comparative summaries, to more complicated analyses that require various forms of cleansing the data, such as removing outliers. OLAP is also known as fast analysis of shared data.
Brushing is a technique in which the user manually chooses specific data points or subsets of data on an interactive data display. These selected data can be visualized in two- or three-dimensional surfaces as scatterplots. Brushing is also known as graphical exploratory data analysis.
Data Mining Models ⬆ ⬇
To generate predictions and infer relationships, the data set, statistics, and patterns identified in existing data must be applied to new data. A data mining model is developed by exercising more than algorithms on data. Specifically, the data mining model consists of a mining structure plus an algorithm. The data mining model remains empty until it applies the algorithm or processes and analyzes the data provided by the mining structure. This model stores the information obtained from a statistical analysis of the data, identifies patterns, and gains insights. It then contains metadata that specify the name and definition of the model, the server location or other place where it is stored, definitions of any filters applied when processing the model, columns from the mining structure that were used to build the model, and the algorithm used to analyze the data. The columns and their data types, any filters, and the algorithm used are choices that are made in the data mining process, and each of these decisions can greatly influence the data mining results. The same data can be used to create many models; one type of model could organize the data into trees, for example, whereas another type of model might cluster the data in groups based on the rules applied. Different results can be achieved from the same mining structure, even though it is used in many models, based on the filtering method or analysis conducted. Therefore, each decision made along the way is very important.
There are many models. In this chapter, the following models will be reviewed: cross-industry standard process for data mining (CRISP-DM), Six Sigma, and SEMMA (sample, explore, modify, model, assess).
CRISP-DM
The CRISP-DM model follows a series of steps to develop a business understanding by gaining an understanding of the business data collected and analyzed. The six steps are business understanding, data understanding, data preparation, modeling, evaluation, and deployment.
The CRISP-DM model begins with an understanding of the business. The situation must be assessed to establish the data mining goals and produce the project plan. The following questions must be answered: What are the business objectives? What are the requirements? Has the problem been specifically defined? The answers to these questions help transform the business perspective knowledge into a data mining problem definition and initial plan to meet the objectives.
Data understanding begins with the preliminary data collection and assimilation of the data. During this step, the data will be described and explored to facilitate the user's comprehension of the data. As the user gains familiarity with the data, data quality issues are identified, and the quality of the data is verified.
The data are cleansed and transformed during the data preparation step. First, one must select the data, attributes, and records to be used. These data are then cleansed, constructed, integrated, and properly formatted. At this point, the final data set is constructed from the data, and this data set will be processed by the model.
Modeling involves selection of the modeling methods and their application to the prepared data set. Parameters are calibrated, a test design is generated, and the model is built and assessed. This step might require that data preparation be revisited if the format of the data does not meet the specific requirements of the methods.
During the evaluation step, the degree to which the objectives were met is assessed from a business perspective. A key question is, Were any important business issues not considered? The model was built for high-quality data analysis. To see whether this goal has been met, the process is reviewed, the results are evaluated, and the model is interpreted. This is where the determination is made as to whether the model should be implemented or more iterations must occur before its deployment. The project may not be completed, or a new data mining project might be initiated. If the project is deployed, this step is when the decision must be made as to how the results from the data analysis will be used.
Deployment is the final step, in which the model is finally implemented. The plan must be monitored and maintained and the project reviewed. The six-step process should yield a reliable, repeatable data mining process. The knowledgeable insights gained from the implementation of the model must be organized and presented in such a way that they can be used. The final project report is generated to document the process and share this enhanced knowledge of the data.
The CRISP-DM model employs a process that has been proven to make data mining projects more rapid and effectual. Using this model helps to avoid typical mistakes while assessing business problems and detailing data mining techniques.
Six Sigma and Lean
Six Sigma and Lean are data-driven methods to eliminate defects, avoid waste, or assess quality control issues. Although Six Sigma and Lean are often considered in tandem, only Six Sigma will be discussed here. Six Sigma aims to decrease discrepancies in business and manufacturing processes through dedicated improvements. It uses the DMAIC steps: define, measure, analyze, improve, and control.
The first step defines the goals of the project or for improvement. During this step, data mining techniques can be used to discover prospective ideas for implementing the project.
In the measure step, exploratory and descriptive data analyses are used on the existing system to enhance the understanding of the data. Reliable, valid, and accurate metrics with which to measure goal achievement in each of the steps are identified.
The analysis step should assess the system to identify discrepancies between the current big data and the goal. Statistical methods guide this analysis.
Improvements must be made to the current system to attain the organizational goals. The use of project management skills facilitates the application of the new methodology and processes. Statistical methods assess the improvements and any deficiencies that exist.
The final step of the model is control. Controlling the system is important so that discrepancies are remedied before they cause a disruption.
The Six Sigma model applies a different mentality to the same old business model or way of thinking. Typically, the DMAIC steps that are implemented result in success.
SEMMA
According to SAS (n.d.), “[t]he acronym SEMMA-sample, explore, modify, model, assess-refers to the core process of conducting data mining” (para. 1). This model is similar to Six Sigma but emphasizes the technical activities typically involved in data mining.
The first step is to sample the data. Sampling is optional but creates a more robust data mining effort. Using “[a] statistically representative sample of your data, SEMMA makes it easy to apply exploratory statistical and visualisation techniques, select and transform the most significant predictive variables, model the variables to predict outcomes, and confirm a model's accuracy” (SAS, n.d., para. 1). Creating a target data set shrinks the data to a manageable size yet maintains the important information necessary to mine.
The exploration of the data seeks to discover discrepancies, trends, and relationships in the data. It is at this point that ideas about the data should emerge to help the organization understand the data and their implications for the organization's business. In health care, for example, it would be important to determine how many people use the emergency department each year and how many of those people are admitted and released and then return and to identify any disparities in care and diagnoses. What was discovered? What are the trends and relationships that emerge from the data mining?
After exploring, the data should be modified based on the information discovered. It might be important to modify the data based on groupings, such as “all people who are diagnosed with congestive heart failure who present with shortness of breath” if the trending and relationships indicate that this subgroup is significant. Other variables can also be introduced at this time to help gain a further understanding of the data.
The data are modeled to predict outcomes based on analytically searching the data. Combinations of data must be identified to predict desired outcomes.
During the assessment phase, the data, as well as the models, are assessed not only for the reliability of the discoveries but also for the usefulness of the data mining process. Assessment is key to determine the success of the data mining approach.
SEMMA focuses on the tasks of modeling. This approach has been praised for its ability to guide the implementation of data mining. Conversely, it has been criticized for omitting the critical features of the organization's business. SEMMA is logical and can be robust from sampling through assessment.
Based on the needs of the organization, a variety of models can be used in combination. A coordinated, cooperative environment is necessary for complicated data mining projects because they require organizational commitment and cooperation among researchers to ensure their success. As described in this section, models, such as CRISP-DM, Six Sigma, and SEMMA, have been designed as blueprints to deal with the dilemma of how to integrate data mining techniques into an organization. They facilitate the gathering of data and their analysis and conversion of the data into information and its dissemination in a format that is easy to understand to inform organizational decision-making. It is imperative that the results of the data mining process be implemented and any resultant improvements are monitored and evaluated.
The data mining field and processes are continuing to evolve. Here are some recent examples of models and algorithms that have been employed to mine complex healthcare data. Singh and Ghalib (2021) described the development and use of a knowledge-based mining and linear analysis model (KB-LA), Klochko et al. (2022) described the use of machine learning with regression analysis in their data mining project, and Nomura et al. (2021) described the use of the Applied Healthcare Data Science Framework to develop a predictive pain management framework. These authors believe that we can expect these data mining models and algorithms to be increasingly shared in a collaborative effort to improve health care.
Benefits of Knowledge Discovery and Data Mining ⬆ ⬇
KDD can enhance the business aspects of healthcare delivery and help to improve patient care. Examples of how KDD can be applied effectively follow:
- A durable medical equipment company analyzed its recent sales and enhanced its targeting of hospitals and clinics that yielded the highest return on investment.
- Several plastic surgery suites were bought by the same group of surgeons. They wanted to know how those organizations were the same and how they were different. They ran analytics for disparities and identified patterns and trends that led them to develop standardized policies and modify treatment plans.
- Analytic techniques were used in the clinical trials of a new oral contraceptive to aid in monitoring trends and disparities.
- Hidden patterns and relationships between death and disease in selected populations can be uncovered.
- Government spending on certain aspects of health care or specific disease conditions can be analyzed to discover patterns and relationships and distinguish between the real versus the desired outcomes from the investment.
- Patient data can be analyzed to identify effective treatments and discover patterns or relationships in the data to predict inpatient length of stay.
- Data can be analyzed to help detect medical insurance fraud.
Even though KDD can be complex, it tends to yield a potent knowledge representation. As analytics evolve, KDD will almost certainly become easier to use and more efficient and effective in facilitating data mining in health care.
Data Mining and Electronic Health Records ⬆ ⬇
As EHRs become more prevalent, the data contained therein can be mined for many clinical and organizational purposes. It has already been established that the use of data-driven decision-making in patient care is supported by sophisticated EHR functions, such as clinical decision support and clinical pathways. Looking beyond the management of individual patient health care, however, it can be seen that EHR data mining can help with managing population health, informing administrative processes, providing metrics for quality improvement, supporting value-based reimbursement, and providing data for registry software that helps with population health management.
Registries are also being used to identify care gaps in patient populations in a physician's practice or other healthcare organization. An article on the Medical Economics (2015) website explained that some EHRs have a built-in registry function, whereas others interface with third-party registries. Registries are designed to do the following:
- Provide lists of subpopulations, such as patients with hypertension and diabetes
- Identify patients with care gaps, based on evidence-based guidelines
- Support outreach to patients who have care gaps
- Provide feedback on how each physician is doing on particular types of care, such as the percentage of their diabetic patients who have their HbA1c levels or blood pressure under control
- Generate quality reports for the practice (para. 17)
Another type of clinical data mining designed to improve patient outcomes is a retrospective look at clinical data in an EHR, known as temporal event analysis (Gotz et al., 2014). As Gotz et al. explained,
[o]ur approach consists of three key components: a visual query module, a pattern-mining module, and an interactive visualization module. We combine these three technologies together within a single framework that enables ad hoc event sequence analysis. With this capability, users are able to discover patterns of clinical events (e.g., sequences of treatments or medications) that most impact outcome. Moreover, our approach allows users to better understand how those associations change as patients progress through an episode of interest. (p. 150)
In addition, data in an EHR can be used for administrative process improvement. Rojas et al. (2016) conducted a literature review on administrative process mining. Process mining is a relatively new use of data generated in hospital information systems and is dependent on event logs generated in the system.
Milinovich and Kattan (2018) described a process used by one prominent midwestern hospital to create research-ready data tables extracted from its EHR system. They used the Unified Medical Language System (UMLS) identifiers to map disparate EHR variables. “By mapping as many variables as possible to UMLS identifiers, a simplified data structure can be implemented to store and query the EHR data. Because the UMLS combines many disparate medical vocabularies into succinct terms, queries become simpler yet more robust with the UMLS's inclusion of relationships, hierarchies, and synonyms among the various terms” (para. 5). This proactive approach to EHR data cleaning helps researchers move almost seamlessly from problem identification to data analysis.
Shickel et al. (2018) conducted a review of the literature to describe deep learning techniques (a specialized form of machine learning) used for the analysis of EHR data. They suggested that deep learning techniques yielded improved predictive models but cautioned that the resultant models were difficult to interpret. “Since correct clinical decision-making can be the difference between life and death, many practitioners must be able to understand and trust the predictions and recommendations made by deep learning systems” (p. 1603). They predict that these deep learning models will improve as research progresses.
It is clear that nurses have only begun to imagine how EHR data mining can inform healthcare practices and support quality improvement.
Ethics of Data Mining ⬆ ⬇
Data mining in health care is dependent on the use of private health information (PHI). Practitioners engaging in data mining must ensure that such data are de-identified and that confidentiality is maintained. Because most data mining depends on the aggregation of data, maintaining individual patient confidentiality should be relatively straightforward. Changes and specific requirements for compliance with the Health Insurance Portability and Accountability Act (HIPAA) can be followed at this website: www.hhs.gov/hipaa/for-professionals/special-topics/research/index.html.
A relatively new ethical issue has surfaced related to digital phenotyping, which is the use of individual data collected by wearable technologies to identify health issues and, more commonly, mental health status. As Martinez-Martin et al. (2018) described, “The novel ethical challenges posed by digital phenotyping arise from the way that the technology can transform seemingly mundane data into powerful indicators of mental function, with implications not only for healthcare but potentially in a range of areas where a measure of a change in cognitive performance or mood might have broad implications” (p. 2). These data are not collected in the healthcare context, and as such they are not subject to HIPAA. However, as Martinez-Martin et al. argued, if these data are to be interpreted as part of the health status, then there needs to be better information provided to the wearers so that they can better control how their data are used. Stay tuned because the informed consent and ethical landscape related to use of personal data is sure to evolve.
Artificial Intelligence, Machine Learning, and Deep Learning ⬆ ⬇
The field of AI deals with the conception, development, and implementation of informatics tools based on intelligent technologies. By using machines, this field attempts to mimic the complex processes of human thought and intelligence. Because of the vast amounts of data generated every day, it was inevitable that health care would enter the AI arena. Although it is not likely that AI and its related components of machine learning and deep learning will replace human thinking and the “art of health care,” they will certainly augment healthcare practice. As Jiang et al. (2017) pointed out, “[b]efore AI systems can be deployed in healthcare applications, they need to be ‘trained' through data that are generated from clinical activities, such as screening, diagnosis, treatment assignment and so on, so that they can learn similar groups of subjects, associations between subject features and outcomes of interest” (p. 230).
Garbade (2018) offered a simple explanation of the differences between AI, machine learning, and deep learning. He provided a diagram of concentric circles (imagine a target) with AI in the outermost ring, machine learning in the middle ring, and deep learning in the central ring. As such, he classified machine learning and deep learning as subsets of AI. If a machine completes a task as a result of a defined set of instructions, also known as an algorithm, “such an ‘intelligent' behavior is what is called artificial intelligence” (para. 13). Machine learning is when machines process large amounts of data and improve their output on the basis of what was learned via the processing. Deep learning utilizes a more sophisticated type of algorithm, known as an artificial neural network. Jiang et al. (2017) further described deep learning processing as the ability to explore a complex neural network with many layers rather than the typical linear processing common in simple neural networks. This technique is particularly useful for analysis of images because of their complexity. Image analysis AI is commonly used in radiology, particularly for analyzing chest X-rays, diagnosing cataracts and retinopathies, and distinguishing between malignant and benign skin lesions (Jiang et al., 2017).
Daley (2023) provided an overview of AI data processing uses in health care. Following are some of the examples:
- PathAI is developing machine learning technology to assist pathologists in making more accurate diagnoses.
- Buoy Health is an AI-based symptom and cure checker that uses algorithms to diagnose and treat illness.
- Enlitic develops deep learning medical tools to streamline radiology diagnoses.
- Freenome uses AI in screenings, diagnostic tests, and blood work to test for cancer.
- Zebra Medical Vision provides radiologists with an AI-enabled assistant that receives imaging scans and automatically analyzes them for various clinical findings it has studied.
- BioXcel Therapeutics uses AI to identify and develop new medicines in the fields of immuno-oncology and neuroscience.
Managing the COVID-19 pandemic also provided some great examples of the use of AI in health care. Best (2020) described that AI is being used to discover drugs already in use that might interfere with the mechanism of infection in COVID-19, detect the outbreak and predict both the spread of the disease and mortality, differentiate COVID-19 lung lesions from other lung diseases in medical images, and monitor the mental health of those experiencing a lockdown. Rowe (2020a) described a conversational AI system that provides automated answers to frequently asked questions to help field the deluge of calls to healthcare systems related to COVID-19. MIT enhanced the SEIR (i.e., susceptible, exposed, infected, recovered) AI algorithm used to predict disease spread “by training a neural network to capture the number of infected individuals who are under quarantine, and therefore no longer spreading the infection to others” (Rowe, 2020b, para. 4). A new AI platform is currently being tested to accelerate data processing in the long, tedious process of developing drugs that may be useful as a treatment or even as a vaccine for COVID-19 (Lennon, 2020). It is important to remember that AI processing makes use of large amounts of data that are aggregated to describe, predict, or prescribe healthcare actions.
Bioinformatics, Biomedical Informatics, and Computational Biology ⬆ ⬇
We conclude our exploration of informatics-based research processes by introducing three additional terms that you are likely to encounter as data mining evolves. The use of supercomputing techniques in each of these related fields is leading to ever-increasing understanding of biological processes. When we are able to glean insights from these complex analyses, we are able to apply these insights to health care and begin to realize positive outcomes. Bioinformatics can be viewed as a biological or a computer science. Public Health Degrees (n.d.) defined bioinformatics as the “application of computer technology and three-dimensional modeling to large sets of biological data” (para. 8).
According to the website of the University of Texas at El Paso (2020), “Bioinformatics is an interdisciplinary science with a focus on data management and interpretation for complex biological phenomena that are analyzed and visualized using mathematical modeling and numerical methodologies with predictive algorithms” (para. 1).
Biomedicine applies information derived from bioinformatics to promote health. According to the website of the Ohio State University College of Medicine (n.d.), “Biomedical Informatics is an interdisciplinary field concerned with unlocking the potential of data and information to solve problems, ultimately improving individual health, health care, public health, and biomedical research” (para. 1).
The Vanderbilt University (n.d.) website suggested that
Biomedical Informatics is the interdisciplinary science of acquiring, structuring, analyzing and providing access to biomedical data, information and knowledge. As an academic discipline, biomedical informatics is grounded in the principles of computer science, information science, cognitive science, social science, and engineering, as well as the clinical and basic biological sciences. (para. 6)
Oregon Health and Science University (n.d.) defined biomedical informatics as “the field that is concerned with the optimal use of information, often aided by the use of technology, to improve individual health, health care, public health, and biomedical research” (para. 1). Biomedical informatics is a growing field, with significant applications and implications throughout the biomedical and clinical worlds. These authors believe that biomedical informatics is the application of bioinformatics to health care. Based on these definitions, one gets a flavor for what bioinformatics entails. It is clear that the definition of bioinformatics varies and that there is no single definition that everyone agrees with at the present time.
Computational biology is the activity of analyzing, synthesizing, and interpreting biological data to develop processes, algorithms, or models in order to comprehend and appreciate biological systems and their interrelationships. Computational biology focuses on “theoretical models, computational simulations, and mathematical models for statistical inference” (Carleton, 2021, para. 4). As Carleton further clarifies, “Scientists choosing to study significantly larger data sets or those that require multiple-server networks should instead turn to bioinformatics, which offers resources better suited to organizing and understanding big data” (para. 10).
Summary ⬆ ⬇
Big data is everywhere-data are collected and stored every second of every day. The data in big clinical data sets can get lost, however, which diminishes their value. Therefore, in health care, it is imperative that KDD and AI be used to analyze these data sets to discover meaningful information that will influence healthcare practice. The existing data repositories are ripe for the picking; they contain hidden patterns, trends, and undiscovered nuggets that must be mined to continue to hone healthcare professionals' understanding and improve health care.
Data management is essential so that this process can begin with clean and accurate data. The decisions that are made when conducting the analysis and developing the model and algorithms enable healthcare professionals to predict and discover patterns and trends in the data, thereby making them meaningful. Meaningful information and knowledge must not only be able to be extracted but also shared and disseminated about what is being learned and the new knowledge being generated.
| Thought-Provoking Questions |
|---|
- Reflect on these terms: database, data warehouse, and data mining. What do they have in common? How do they differ?
- Describe an issue associated with healthcare data that impedes the construction of meaningful databases and inhibits the data mining process. Which strategies would you use to remedy this situation? Thoroughly describe one strategy and its potential outcomes.
- Suggest a data mining project for your practice. Which information would you like to have about your practice area that could be extracted using data mining strategies?
- Data mining is associated with numerous techniques and algorithms. How can you make sure that you select and develop those that best fit your data?
|
References ⬆
- Berger A. M., & Berger C. R. (2004). Data mining as a tool for research and knowledge development in nursing. CIN: Computers, Informatics, Nursing, 22(3), 123-131. https://doi.org/10.1097/00024665-200405000-00006
- Best J. (2020, April 9). AI and the coronavirus fight: How artificial intelligence is taking on COVID-19. ZDNet. www.zdnet.com/article/ai-and-the-coronavirus-fight-how-artificial-intelligence-is-taking-on-covid-19
- Carleton S. (2021, May 28). Computational biology vs. bioinformatics: What's the difference? Northeastern University Graduate Programs. https://graduate.northeastern.edu/resources/computational-biology-vs-bioinformatics
- Chen Y. (2021). Optimization of clinical nursing management system based on data mining. Complexity, 2021, 1-11. https://doi.org/10.1155/2021/2110154
- Conca T., Saint-Pierre C., Herskovic V., Sepúlveda M., Capurro D., Prieto F., & Fernandez-Llatas C. (2018). Multidisciplinary collaboration in the treatment of patients with type 2 diabetes in primary care: Analysis using process mining. Journal of Medical Internet Research, 20(4), e127. https://doi.org/10.2196/jmir.8884
- Daley S. (2023, March 24). Artificial intelligence in healthcare: 39 examples improving the future of medicine. Built In. https://builtin.com/artificial-intelligence/artificial-intelligence-healthcare
- De Gagne J. C., Hall K., Conklin J. L., Yamane S. S., Wyman Roth N., Chang J., & Kim S. S. (2019). Uncovering cyberincivility among nurses and nursing students on Twitter: A data mining study. International Journal of Nursing Studies, 89, 24-31. https://doi.org/10.1016/j.ijnurstu.2018.09.009
- Fernández-Llatas C., Garcia-Gomez J. M., Vicente J., Naranjo J. C., Robles M., Benedi J. M., & Traver V. (2011, August 30-September 3). Behaviour patterns detection for persuasive design in nursing homes to help dementia patients. Annual International Conference of the IEEE Engineering in Medicine & Biology Society, 6413-6417. https://doi.org/10.1109/IEMBS.2011.6091583
- Garbade M. (2018, September 14). Clearing the confusion: AI vs machine learning vs deep learning differences. Towards Data Science. https://towardsdatascience.com/clearing-the-confusion-ai-vs-machine-learning-vs-deep-learning-differences-fce69b21d5eb
- Goodwin L., Saville J., Jasion B., Turner B., Prather J., Dobousek T., & Egger S. (1997). A collaborative international nursing informatics research project: Predicting ARDS risk in critically ill patients. Studies in Health Technology Informatics, 46, 247-249.
- Gotz D., Wang F., & Perer A. (2014). A methodology for interactive mining and visual analysis of clinical event patterns using electronic health record data. Journal of Biomedical Informatics, 48, 148-159. https://doi.org/10.1016/j.jbi.2014.01.007
- Green J., Paladugu S., Shuyu X., Stewart B., Shyu C., & Armer J. (2013). Using temporal mining to examine the development of lymphedema in breast cancer survivors. Nursing Research, 62(2), 122-129. https://doi.org/10.1097/NNR.0b013e318283da67
- Härkänen M., Vehviläinen-Julkunen K., Murrells T., Paananen J., Franklin B. D., & Rafferty A. M. (2020). The contribution of staffing to medication administration errors: A text mining analysis of incident report data. Journal of Nursing Scholarship, 52(1), 113-123. https://doi.org/10.1111/jnu.12531
- Jiang F., Jiang Y., Zhi H., Dong Y., Li H., Ma S., Wang Y., Dong Q., Shen H., & Wang Y. (2017). Artificial intelligence in healthcare: Past, present and future. Stroke and Vascular Neurology, 2(4), 230-243. http://dx.doi.org/10.1136/svn-2017-000101
- Jin D. (2022). Risk prediction method of obstetric nursing based on data mining. Contrast Media and Molecular Imaging, 2022, 5100860. https://doi.org/10.1155/2022/5100860
- Klochko O. V., Gurevych R. S., Nagayev V. M., Yu Dudorova L., & Zuziak T. P. (2022). Data mining of the healthcare system based on the machine learning model developed in the Microsoft Azure Machine Learning Studio. Journal of Physics: Conference Series, 2288(1), 12006. https://doi.org/10.1088/1742-6596/2288/1/012006
- Kumaraswamy N., Markey M. K., Ekin T., Barner J. C., & Rascati K. (2022). Healthcare fraud data mining methods: A look back and look ahead. Perspectives in Health Information Management, 19(1), 1-18.
- Lee T., Lin K., Mills M., & Kuo Y. (2012). Factors related to the prevention and management of pressure ulcers. CIN: Computers, Informatics, Nursing, 30(9), 489-495. https://doi.org/10.1097/NXN.0b013e3182573aec
- Lee T., Liu C., Kuo Y., Mills M., Fong J., & Hung C. (2011). Application of data mining to the identification of critical factors in patient falls using a web-based reporting system. International Journal of Medical Informatics, 80(2), 141-150. https://doi.org/10.1016/j.ijmedinf.2010.10.009
- Lennon A. (2020, April 30). Researchers use AI to accelerate COVID-19 drug development. LabRoots. www.labroots.com/trending/drug-discovery-and-development/17505/researchers-ai-accelerate-covid-19-drug-development
- Li H., Lin S., & Hwang Y. (2019). Using nursing information and data mining to explore the factors that predict pressure injuries for patients at the end of life. CIN: Computers, Informatics, Nursing, 37(3), 133-141. https://doi.org/10.1097/CIN.0000000000000489
- Li Y., & Beaubouef T. (2010). Data mining: Concepts, background and methods of integrating uncertainty in data mining. Southeastern Louisiana University. www.ccsc.org/southcentral/E-Journal/2010/Papers/Yihao%20final%20paper%20CCSC%20for%20submission.pdf
- Madigan E., & Curet O. (2006). A data mining approach in home healthcare: Outcomes and service use. BMC Health Services Research, 6, 18. https://doi.org/10.1186/1472-6963-6-18
- Martinez-Martin N., Insel T. R., Dagum P., Greely H. T., & Cho M. K. (2018). Data mining for health: Staking out the ethical territory of digital phenotyping. NPJ Digital Medicine, 1, 68. https://doi.org/10.1038/s41746-018-0075-8
- Medical Economics. (2015, March 13). Mining EHR data for quality improvement.www.medicaleconomics.com/view/mining-ehr-data-quality-improvement
- Microsoft. (2022, December 9). Mining models. https://learn.microsoft.com/en-us/analysis-services/data-mining/mining-models-analysis-services-data-mining?view=asallproducts-allversions
- Milinovich A., & Kattan M. W. (2018). Extracting and utilizing electronic health data from Epic for research. Annals of Translational Medicine, 6(3), 42. https://doi.org/10.21037/atm.2018.01.13
- Molteni M. (2018). 23andMe's pharma deals have been the plan all along. Wired. www.wired.com/story/23andme-glaxosmithkline-pharma-deal
- National Institutes of Health. (2021). Big data to knowledge (BD2K).https://commonfund.nih.gov/bd2k
- Nomura , A. T. G., Almeida , M. D. A., Johnson S., & Pruinelli L. (2021). Pain information model and its potential for predictive analytics: Applicability of a big data science framework. Journal of Nursing Scholarship, 53(3), 315-322. https://doi.org/10.1111/jnu.12648
- Ohio State University College of Medicine. (n.d.). Informatics education. https://medicine.osu.edu/departments/biomedical-informatics/education
- Oregon Health and Science University. (n.d.). What is biomedical informatics.www.ohsu.edu/school-of-medicine/medical-informatics-and-clinical-epidemiology/what-biomedical-informatics
- Public Health Degrees. (n.d.). Health informatics vs. bioinformatics. www.publichealthdegrees.org/careers/health-informatics-vs-bioinformatics
- Rojas E., Munoz-Gama J., Sepúlveda , M., & Capurro D. (2016). Process mining in healthcare: A literature review. Journal of Biomedical Informatics, 61, 224-236. https://doi.org/10.1016/j.jbi.2016.04.007
- Rowe J. (2020a, April 15). How conversational AI is plugging in to help with questions about COVID-19. AI Powered Healthcare. www.healthcareitnews.com/ai-powered-healthcare/how-conversational-ai-plugging-help-questions-about-covid-19
- Rowe J. (2020b, April 22). MIT algorithm gauges impact of quarantines on spread of COVID-19. AI Powered Healthcare. www.healthcareitnews.com/ai-powered-healthcare/mit-algorithm-gauges-impact-quarantines-spread-covid-19
- SAS. (n.d.). SAS enterprise miner. www.sas.com/en_us/software/enterprise-miner.html
- Shickel B., Tighe P. J., Bihorac A., & Rashidi P. (2018). Deep EHR: A survey of recent advances in deep learning techniques for electronic health record (EHR) analysis. IEEE Journal of Biomedical and Health Informatics, 22(5), 1589-1604. https://doi.org/10.1109/JBHI.2017.2767063
- Simpson R. L. (2019). Big data fuels unstoppable change. Nursing Administration Quarterly, 43(4), 378-380. https://doi.org/10.1097/NAQ.0000000000000373
- Singh A. K., & Ghalib M. R. (2021). KM-LA: Knowledge-based mining for linear analysis of inconsistent medical data for healthcare applications. Personal and Ubiquitous Computing, 2021. https://doi.org/10.1007/s00779-020-01509-w
- Taylor D. (2023, September 21). What is big data? Introduction, types, characteristics, examples. Guru99. www.guru99.com/what-is-big-data.html
- Thorlton J., & Catlin A. C. (2019). Data mining for adverse drug events: Impact on six learning styles. CIN: Computers, Informatics, Nursing, 37(5), 250-259. https://doi.org/10.1097/CIN.0000000000000513
- Trangenstein P., Weiner E., Gordon J., & McNew R. (2007). Data mining results from an electronic clinical log for nurse practitioner students. Studies in Health Technology Informatics, 129(Pt. 2), 1387-1391.
- University of Pittsburgh. (2021, January 13). The role of data analytics in healthcare.https://online.shrs.pitt.edu/blog/data-analytics-in-health-care
- University of Texas at El Paso. (n.d.). College of Science: Bioinformatics. http://bioinformatics.utep.edu
- Vanderbilt University. (n.d.). Biomedical informatics: Research MS and PhD program. https://medschool.vanderbilt.edu/biomedical-informatics/research-ms-and-phd-program
- Vennaro N. (2017, March 2). Buy (don't build) healthcare data insights to improve data investment ROI. MedCity News. https://medcitynews.com/2017/03/buy-dont-build-healthcare-data-insights-improve-data-investment-roi
- White House Office of Science and Technology Policy. (2020, March 16). Call to action to the tech community on new machine readable COVID-19 dataset. https://trumpwhitehouse.archives.gov/briefings-statements/call-action-tech-community-new-machine-readable-covid-19-dataset
- Zarrinpar A., David Cheng T., & Huo Z. (2019). What can we learn about drug safety and other effects in the era of electronic health records and big data that we would not be able to learn from classic epidemiology? Journal of Surgical Research, 246, 599-604. https://doi.org/10.1016/j.jss.2019.09.053