The changes in brain states under sedation and general anesthesia are readily visible in the EEG signal tracing. However, it is challenging to interpret dynamic changes in frequencies and amplitudes in the real-time EEG signal, which is typically displayed in a 4-second sliding time window.
The power spectrum is a decomposition of a segment of EEG into its power (usually in dB) as a function of frequency. Because the spectrum captures only one instance in time, it has limited utility during a dynamic anesthetic state (Figure 16.3).
FIGURE 16.3 The plot of power (usually in decibels, dB) against the frequencies being analyzed is the power spectrum.
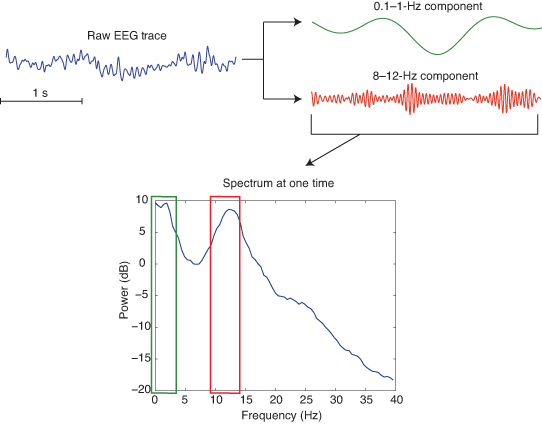
EEG trace breakdown: raw signal, extracted components (0.1-1 Hz, 8-12 Hz), and a power spectrum plot showing frequency (Hz) vs power (dB).
Taking the spectrum plots at several adjacent time intervals and stacking them together forms a spectrogram. The spectrogram is a plot of power by frequency as a function of time.
The 3D spectrogram (also called the compressed spectral array) can be flattened into a 2D plot (also called the density spectral array) with power mapped onto a color scale, which is displayed on monitors in the operating room (Figure 16.4). These 2D spectrograms give a visual representation of the EEG structure in a manner that facilitates analysis and tracking of the brain states under anesthesia over time.
FIGURE 16.4 Construction of the spectrogram: The power spectrum plot at several points in time can be stacked together to form a 3D spectrogram (middle). The spectrogram still retains the frequency and power axes but has the helpful addition of a time axis. The 3D spectrogram flattened into a 2D plot (bottom) is what is displayed intraoperatively on brain function monitors. Of note, as indicated on the power scale, red indicates high power and blue indicates low power.
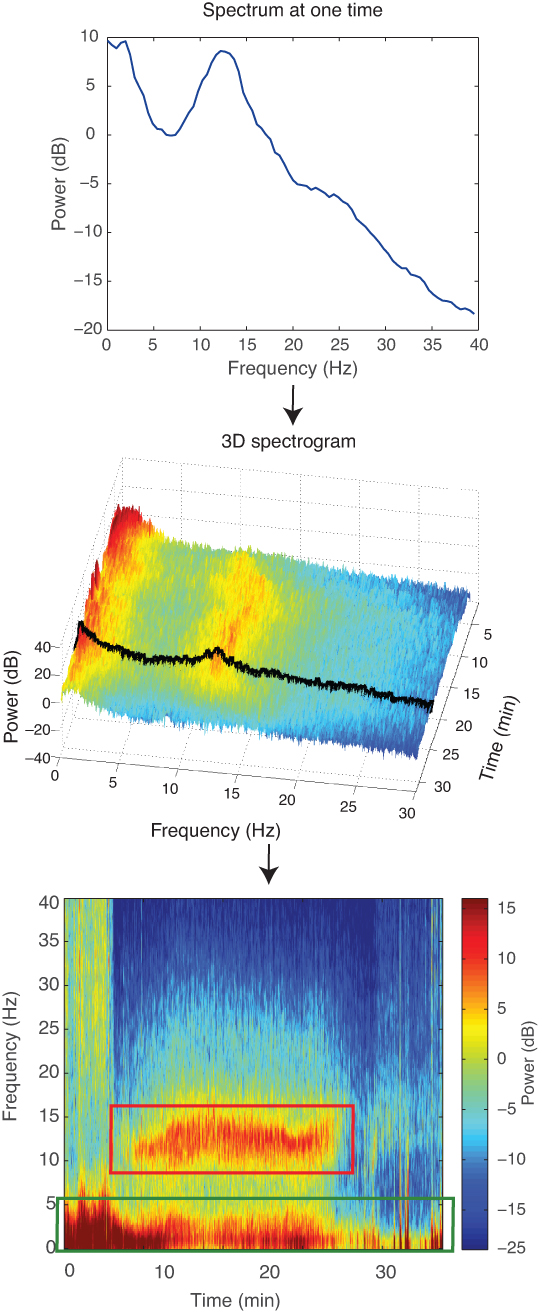
Spectrograms showing signal power by frequency over time, using 2D/3D representations. Red and green boxes highlight specific frequency ranges.