From this point on, we will be building on earlier principles. In this chapter, we will move on to statistical concepts related to measuring factors that interest nurse clinicians and investigators. This chapter will prepare you to:
Distinguish between independent and dependent variables.
Differentiate the levels of measurement and understand why this idea is important in statistics.
Discuss the application of levels of measurement to evidence-based practice.
Define instrument reliability and validity and discuss the importance of addressing these before measuring variables with an instrument.
Understand how measurement decisions influence the quality of research.
Categorical variables
Confounding variables
Construct
Construct validity
Content validity
Continuous variables
Criterion-related validity
Data
Data set
Dependent variable
Discrete variables
External validity
Independent variable
Instrument
Internal consistency
Internal validity
Interrater reliability
Interval level of measurement
Levels of measurement
Measurement error
Nominal level of measurement
Ordinal level of measurement
Qualitative variables
Quantitative variables
Random errors
Ratio level of measurement
Reliability
Systematic errors
Test-retest reliability
Tool
Validity
Variable
Nurse investigators define variables and collect data to answer important questions. Often, these investigations originate in our observations of a problem, such as "Why do patients have difficulty managing their hypertension?" At the beginning of any investigation, we must be as precise as possible in identifying what exactly we are studying and how best to measure that phenomenon. We must be able to identify the factors or variables of interest. A variable is a trait or characteristic that varies or changes, and data are the values of variables when they vary. For example, systolic blood pressure is a variable because it is a characteristic that fluctuates, both from one person to another and at different times within the same person (Figure 4-1). Each blood pressure measurement is a data value. A collection of these data values is a data set.
Variables and data.
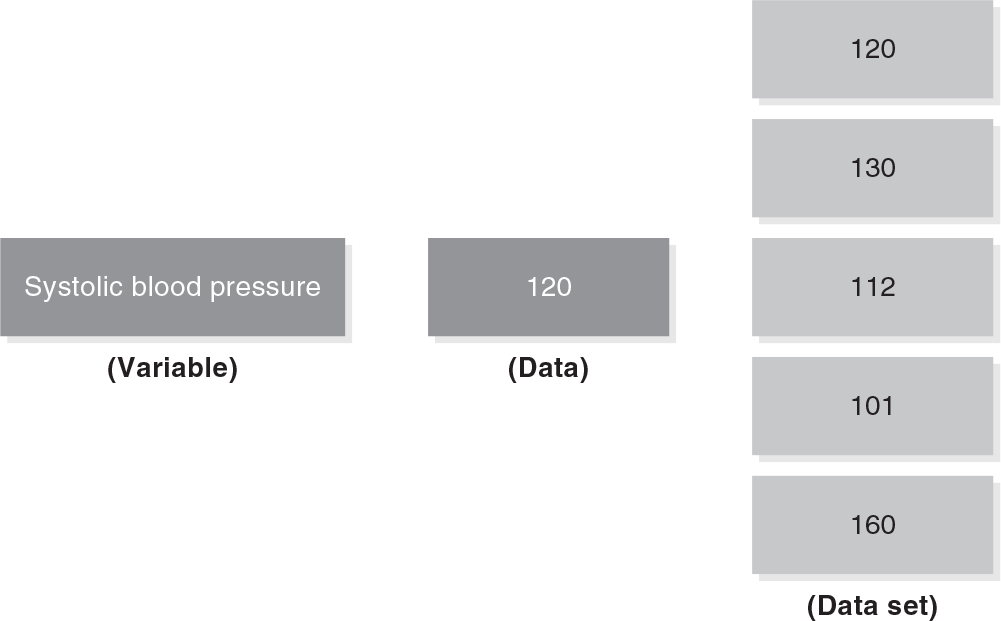
A diagram shows the variable, systolic blood pressure, followed by the data, 120, and followed by the data set with the data list, 120, 130, 112, 101, and 160, one below the other.
Investigators classify variables according to various characteristics that suggest how variables may be used in research and evidence-based practice studies. Variables may be qualitative or quantitative. Qualitative variables have nonnumeric values, and quantitative variables have numeric values. Systolic blood pressure may be either qualitativehigh, normal, or lowor quantitative120 mmHg. In this text, we will confine ourselves to numeric variables, which are amenable to statistical analyses.
Numeric variables may be either discrete or continuous. Discrete variables have countable values but do not include the fractions between countable categories. Continuous variables have every possible value on a continuum. Gender may be counted, as in there are 10 women in a waiting area, and this is an example of a discrete variable; this is because, in the real world, there is no such thing as 10.5 women. In contrast, systolic blood pressure ranging from 0 to 200 mmHg is an example of a continuous variable because we could measure the pressure anywhere between 0 and 200 mmHg. Conceivably, we could measure systolic blood pressure to the nearest hundredth mmHg, for example, 120.05 mmHg.
Variables can also be characterized as independent or dependent when an investigator studies the interaction between variables for statistical hypothesis testing. The variable that is manipulated by the investigator or affects another variable is the independent variable. The dependent variable is affected by an independent variable. For example, suppose an investigator examines whether hepatitis B antigen affects liver function test results. The presence or absence of the hepatitis B antigen is the independent variable, as it affects the liver function test results, and the liver function test result is the dependent variable, as it is affected by the hepatitis B antigen.
Consider another example. An investigator is studying a newly developed medicine's effectiveness in treating constipation. The investigator devises an experiment in which the treatment group receives the new medication and the control group receives a placebo. The investigator measures the number of days between taking the drug and the first bowel movement among participants in both control and treatment groups. Here, the group assignmenttreatment or controlis the independent variable because the investigator manipulates it and it affects the length of time until the first bowel movement. The number of days until the first bowel movement is the dependent variable because it is affected by the group assignment or whether the participant received the new drug or the placebo.
In the previous two examples, it is clear how independent variables differ from dependent variables. However, defining the independent and dependent variables may also be related to how the investigator postulates the relationship between the variables. For example, an investigator is studying the relationship between social support and quality of life in older adults in assisted-living environments. The investigator hypothesizes that social support influences the quality of life of these older adults. In this example, it seems clear that social support is the independent variable, and quality of life is the dependent variable. However, the investigator could propose the equally valid hypothesis that quality of life influences social support.
Determining the number of independent variables in a study can also be confusing. Suppose an investigator is studying the passing rates of the licensure examination of graduating nurses from 2023, 2024, and 2025 at a public university. In this case, the graduating class is the independent or grouping variable and the passing rate is a dependent variable. However, it can initially seem like the three graduating classes are three different independent variables, whereas the graduating class is a single independent variable with three levels (Figure 4-2).
Types of variables.
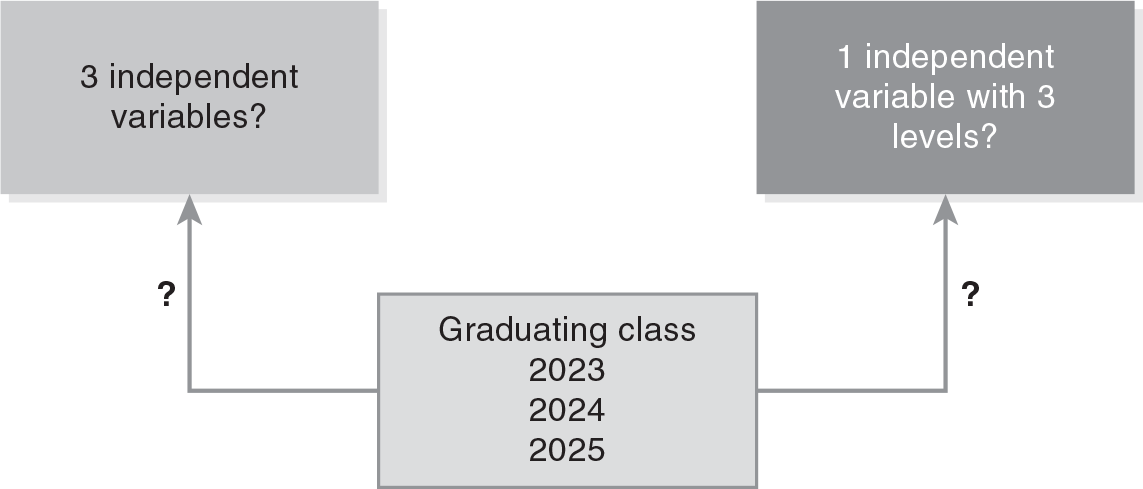
A flowchart of graduating classes 2023, 2024, and 2025 splitting into 3 independent variables? and 1 independent variable with 3 levels.
Evaluating VariablesHas the investigator explicitly identified and defined the variables in the study?
Is there a logical connection between the variables so the reader can correctly identify independent and dependent variables?
In high-quality studies, the investigator provides a logical argument for defining the independent and dependent variables and their hypothesized relationship. The nurse using research for evidence-based practice must know how to evaluate such arguments and decide on the legitimacy of the approach used.
Understanding what variables are, how they are classified, and how they are related is crucial in deciding what statistical method is appropriate for analyzing data. Like other skills, the more you use your knowledge about variables, the more proficient you will become.
Wound healing is an important indicator of nursing care across various settings. Let us consider an example where we are interested in implementing a wound-healing intervention based on research evidence. In this imaginary study, the authors report that wounds healed 50% faster with the intervention than with another commonly used treatment. To evaluate the effectiveness of this intervention (independent variable), we need to know how wound healing (the dependent variable) was measured to determine if the new intervention is an improvement over other treatment approaches.
After defining the variables of interest, the investigator must think about how to measure the variables. There are four levels of measurement: nominal, ordinal, interval, and ratio (Table 4-1). It is essential to understand the level of measurement because different statistical procedures require different levels of measurement on the variables of interest. Measurement is also important for applying evidence to practice. Let us discuss each level of measurement, one by one, and identify how they differ.
Nominal | Ordinal | Interval | Ratio |
|---|---|---|---|
Gender identity | Pain scale (0-10) | Temperature | Age |
Ethnicity | Age groups (18-25, 26-35, etc.) | IQ | Height |
Vaccination status (Yes/No) | Grade (A, B, C, D, and F) | SAT score | Weight |
Type of nursing unit (ICU, ER, Med-Surg, OB) | Histological opinion (-/±/+/++/+++) | Depression score | Blood pressure |
Medical diagnosis | Patient satisfaction scale (poor, acceptable, good) | Time of day | Years of work experience |
Names of medicines | Nurse performance (below average, average, above average) | Dates (years) | Time to complete a task |
In nominal level of measurement, data are classified into mutually exclusive categories (data can only be in one category) where no ranking or ordering is imposed on categories. The word nominal means to name. Common examples in this level of measurement are gender identity and ethnicity; an investigator can classify the subjects as men, women, or transgender for gender and as different ethnic groups (e.g., White, Black, Asian, or Hispanic group), respectively. However, no ranking or order can be imposed on any of those categories, as we cannot say that one gender or ethnic group is superior/inferior or is more or less than the other groups. Other examples of nominal level of measurement include religious affiliation (e.g., follower of Christianity, follower of Catholicism, or follower of Buddhism), political party affiliation (e.g., Democrat, Independent, or Republican), and hair color (e.g., black, brown, or blond). Nominal measurement is often used in health-related research to characterize a wide variety of variables, such as treatment results (improvement or recurrence) and signs and symptoms (present or not present).
In the ordinal level of measurement, data are also classified into mutually exclusive categories. However, ranking or ordering is imposed on categories. A typical example in this level of measurement is grouped age. People can be categorized into one of the following groups: (1) 18 and under, (2) 19-30, (3) 31-49, and (4) 50 and above. Here, we have distinctive categories with no overlapping (mutually exclusive categories) and a clear ranking or ordering among categories. Category (2) has older people than category (1), but younger people than categories (3) and (4). Other examples of ordinal level of measurement include letter grade (A, B, C, D, F), Likert-type scales (strongly disagree, somewhat disagree, neutral, somewhat agree, strongly agree), ranking in a race (first, second, third, etc.), and histological ratings (−, ±, +, ++, +++). A standard pain scale, ranking from 0 to 10, is an excellent example of ordinal level of measurement in healthcare, where 0 is equal to no pain and 10 is severe pain. Although these data can be ordered, we cannot accurately determine the distance between the two categories. That is, we cannot say that the interval between 1 and 2 on a pain scale is precisely the same as the interval between 3 and 4.
In the interval level of measurement, data are classified into categories with rankings and are mutually exclusive as in the ordinal level of measurement. In addition, specific meaning is applied to the distances between categories. These distances are assumed to be equal and can be measured. Temperature, for example, is measured on categories with equal distance, and any value is possible; the distance or interval between 35°F and 40°F is the same as the distance or interval between 55°F and 60°F. However, in the interval level of measurement, there is no absolute value of "zero." Zero degrees Fahrenheit is different from zero degrees Celsius. Therefore, there is no absolute or unconditional meaning of zero. In addition, we cannot say 25°F is three times as cold as 75°Fthat is, there is no concept of ratio, or equal proportion, in interval level of measurement. Other examples of interval level of measurement include standardized tests such as intelligence quotient (IQ) or educational achievement tests. In health care, we often use interval level of measurement for clinical purposes.
In the ratio level of measurement, all characteristics of the interval level of measurements are present; there is a meaningful zero, and a ratio or equal proportion is present. For example, income is measured on scales with equal distance and a meaningful zero. The income measurement for someone will be zero if they have no source of livelihood. We may also say that someone making $60,000 a year makes precisely twice as much as someone making $30,000 a year. Blood pressure is another example of a ratio level of measurement, as it is possible to have a blood pressure of zero and a systolic pressure of 100 mmHg is twice that of 50 mmHg. Other examples of ratio level of measurement are age, height, and weight.
The level of measurement is important because it directs what statistical tests may be used to analyze the data sets collected by the investigator. Clinicians who understand the relationship between the level of measurement and choice of statistical test can evaluate the strength of any given study. Table 4-2 presents some examples of statistical tests per level of measurement.
Independent Variable | Dependent Variable | Statistical Test to Be Utilized |
|---|---|---|
Nominal (control/patient) | Ratio (systolic blood pressure) | Independent sample t-test, paired sample t-test |
Nominal or ordinal (low/middle/high systolic blood pressure) | Ratio (liver function) | One-way analysis of variance (ANOVA) |
More than one nominal or ordinal (systolic blood pressure group + gender) | Ratio (liver function) | Factorial ANOVA |
Nominal (control/patient) | Nominal (person with or without diabetes) | Chi-square test of association |
Nominal + ratio (control/patient + age) | Nominal (person with or without diabetes) | Logistic regression |
Ratio (weight) | Ratio (systolic blood pressure) | Correlation, simple linear regression, multiple linear regression (if more than one independent variable) |
Nominal with ratio to control (control/patient with age to control) | Ratio (systolic blood pressure) | Analysis of covariance (ANCOVA) |
One or more nominal or ordinal (systolic blood pressure group) | More than one ratio (liver function + depression) | Multivariate analysis of variance (MANOVA) |
There are times when an investigator may choose to reclassify or transform a variable's level of measurement. For example, blood pressure that is measured initially at the ratio level may be transformed to an ordinal level of measurement if the investigator categorizes the blood pressure in intervals of 40 (i.e., 0-40, 41-80, 81-120, and 121-140), or transforms it into categories of "high" and "low." There may be sound reasons for such transformations, such as wanting to compare people in those categories. However, transformation from a higher level of measurement to a lower level (ratio to ordinal, for example) will always result in the loss of information, as everyone with blood pressure between 41 and 80 is categorized into a single group. Second, it limits analysis to those statistical tests for categorical measurements. To return to our earlier discussion of variables, variables measured at the nominal and ordinal levels of measurements are discrete or categorical variables, and those measured at interval and ratio measurements are continuous variables.
In addition to determining what level of measurement will be needed for any given variable, the investigator designing a study needs to choose the best measurement tools. A tool or instrument is a device for measuring variables. Examples include paper-and-pencil surveys or tests, scales for measuring weight, and an eye chart for estimating visual acuity. There may be one or more measurement tools available for variables of interest, or there may be none, and then a tool will need to be created. Whether you use an existing tool or create one, you should ensure the measurement tool is the best approach for measuring the variable of interest. Reliable and valid instruments will reduce the likelihood of measurement error.
Measurement error is the difference between measured and true values. Measurement error is unavoidable in research and can be either systematic or random. Systematic errors occur consistently because of known causes and random errors occur by chance and result from unknown causes. One common source of systematic error is the incorrect use of tools or instruments. For example, suppose that you need to measure depression in older adults, and you found an instrument, Beck's Depression Inventory (BDI) (Beck et al., 1961). Would you start measuring older adults' depression levels using the BDI right away? Probably not! First, you would want to ensure that the BDI is a good measurement tool for assessing depression in older adults. The concepts of reliability and validity help us to make that decision.
Reliability tells us whether or not a test or tool can consistently measure a variable. If a patient scores 35 on the BDI over and over again, it means that BDI is reliable because it measures depression consistently at different times. Whether you are engaged in research, evidence-based practice, quality improvement, or process improvement, choosing a dependable measurement tool is important.
There are three commonly used statistical evaluations of reliability, and they are all correlation coefficients: internal consistency, test-retest, and interrater reliability. Internal consistency measures whether items within a tool, such as a depression scale, measure the same thing (i.e., are they consistent with one another?). Cronbach's alpha, the most commonly used coefficient, ranges from 0 to 1, with a higher coefficient indicating that the items consistently measure the same variable. Note that Cronbach's alpha is normally used when the level of measurement is interval or ratio, and the Kuder-Richardson (KR-20) coefficient is used when the level of measurement is nominal or ordinal. Test-retest reliability is used to address the consistency of the measurement from one time to another. If the tool is reliable, the subjects' scores should be similar at different measurement times. Investigators commonly correlate measurements taken at various times to determine their consistency. The higher the correlation coefficient, the stronger the test-retest reliability. Interrater reliability is used to determine the degree of agreement between individuals' scores on ratings (i.e., are they giving consistent ratings?). Cohen's kappa is commonly used and ranges from 0 to 1, with a coefficient of 1 signifying perfect agreement. For example, pressure ulcers are often scored on a scale reflecting depth, area, color, and drainage. If two nurses use a rating scale to score the seriousness of pressure ulcers, we would want to know how consistent the scores are between the nurses. Ideally, both nurses would score the same pressure ulcer very closely.
Several factors influence Instrument reliability. For surveys or inventories such as the BDI, the length of the tool influences reliability. The shorter the tool is, the less reliable it will be because it will be more challenging to include all aspects of the variable under study. The second factor is the clarity of expression of each question or item. Confusing questions/items introduce measurement error. The third factor is the time allowed to complete the measurement tool. If the investigator does not allow participants enough time, reliability will decline. The fourth factor is the condition of test takers on the measurement day. If a test taker is ill, tired, or distracted, these conditions can negatively affect the reliability of the measurement tool. The fifth factor is the difficulty of the measurement tool. If the tool is not designed appropriately for the target audience, it can affect the reliability positively and negatively; reliability will be inflated if the tool is too easy for the target audience and deflated if it is too difficult for the target audience. Lastly, the investigator must consider the homogeneity of the subjects, that is, how similar the participants in a study are to one another. If the subjects in a group are very alike, they will respond similarly to the instrument and produce similar scores, resulting in high reliability. If the subjects in a group are heterogeneous, their scores will range widely, and reliability will be lower.
Reliability in its simplest form may be thought of as consistency or stability, and this is an essential element to consider when choosing a measurement tool. However, consistency/reliability does not imply accuracy. For example, if we have a thermometer that consistently measures temperature two degrees above the actual temperature, it is reliable but not particularly accurate. In health care and nursing, measurement accuracy is extremely important, and instruments must be assessed for this element in research reports.
Validity tells us whether a tool, an instrument, or a scale measures the variable it is supposed to measure. There are three main types of validity: content, criterion-related, and construct. Content validity concerns whether a measurement tool measures all aspects of the idea of interest. For example, the BDI would not be a valid measure of depression if it did not include somatic symptoms of depression. Criterion-related validity is how strongly a measure correlates with a standard or benchmark. For example, suppose you wanted to validate the usefulness of a new depression scale, the Patient Health Questionnaire depression scale (PHQ-9) (Kroenke & Spitzer, 2002). An investigator might administer both the BDI, a known and accurate measure of depression, and the new instrument, the PHQ-9, to a group of patients with depression and compute a correlation coefficient for two scales. A strong association between the BDI and the new PHQ-9 would establish the criterion-related validity of the PHQ-9. Construct validity is the extent to which a measurement tool scores correlate with a construct we wish to measure. A construct may be thought of as an idea or concept. For example, an investigator can ask themself this question: "Am I measuring depression with the BDI, or could it also be measuring anxiety?"
Why do we care about measurement quality in a study? As an investigator or when applying evidence to practice, nurses must be able to estimate how closely a study represents the actual phenomenon of interest and the strength of inferences we can make. The quality of measurement, along with other factors such as the nature of the sample, helps us judge whether or not the findings of a study are generalizable. We base this evaluation on a study's internal and external validity.
Internal validity is the extent to which we can say with any certainty that the independent and dependent variables are related. The strength of the internal validity of a study is often evaluated based on whether any uncontrolled or confounding variables may influence this relationship between independent and dependent variables. Such confounding variables may include outside events that happened during the study. These confounding events may cause a change in scores or measurements and result in less accurate findings. Changes in the participants because of aging or history may also introduce an element of inaccuracy. In longitudinal studies, for example, past experience with the measurement tool may also confound results, as merely having been exposed to the tool previously may influence the subjects' performance on the later measurements. The choice of sampling, random or nonrandom, will also influence internal validity. Random sampling ensures that all participants are equal in every way, reducing the likelihood of confounding variables influencing the study results. Finally, human beings are prone to change their behavior when they know that they are being studied (i.e., the Hawthorne effect) and this introduces bias that is difficult to quantify and explain.
External validity is about whether the results of a study can be generalized beyond the study itself. Can we make accurate inferences about the population from our selected sample? Can we verify with any confidence the hypothesis that we are testing? The quality of the sample influences external validity. If the characteristics of the sample used in the study do not represent the population, the results from the study should not be generalized or inferred to the population. External validity is also influenced by measurement. If our measures are unreliable or inaccurate measures of the variables of interest, then we cannot make valuable inferences about those variables.
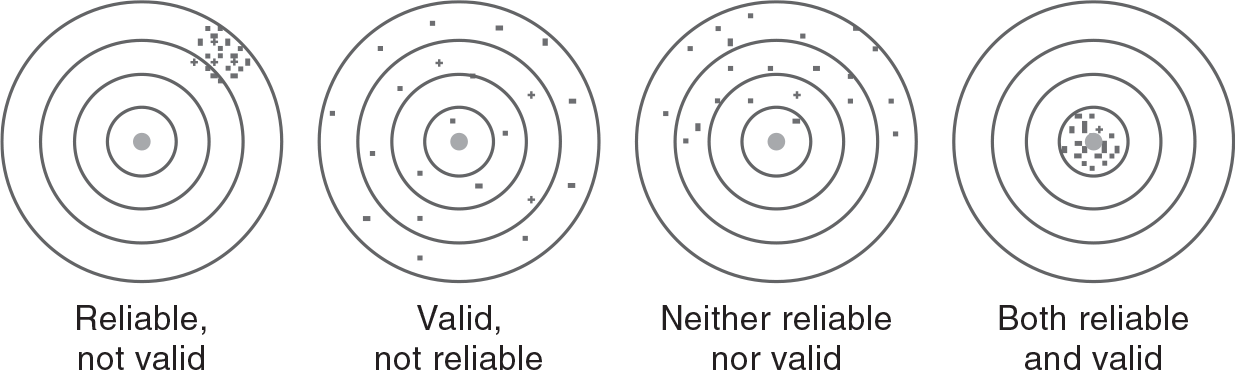
Reliability and validity are important concepts when using a measurement tool. You should make sure that the tool used is both reliable and valid and that its limitations are discussed if the tool is not proved to be reliable or valid. One thing to note is that reliability always precedes validity (Figure 4-3). An instrument can be reliable but not valid, but an instrument cannot be valid without being reliable. You cannot make inferences following statistical tests unless you ensure that the tool has the appropriate reliability and validity for your sample.
Reliability and validity.
Four diagrams depict the difference between reliability and validity.
Each diagram consists of four concentric circles. Reliable, not valid: There are multiple dots covering an area between the third and the fourth circles. Valid, not reliable: The dots are spread evenly over all the circles. Neither reliable nor valid: The dots are spread in the upper half of the circles. Both reliable and valid: The dots appear on and around the center point of the circles.
Evaluating MeasuresDo the measures selected for the study align with the variables identified in the study?
Have the investigators reported the reliability and validity of the measures and instruments?
Have the investigators reported on limitations related to measurement?
Mazanec et al. (2021) conducted a descriptive, correlational, and cross-sectional study that investigated if environmental aspects (social support, healthcare system distrust, and economic hardship) predicted symptom distress in women with breast cancer before starting chemotherapy.
Data from the participants (n = 119) in an ongoing and longitudinal study were analyzed. Their finding was that Black women reported more distress than White women. Additionally, women with greater economic difficulty experienced more symptom distress. However, social support, healthcare system distrust, and race did not predict symptom distress.
The investigators used reliable and valid instruments to measure the independent variables (Interpersonal Support Evaluation List, Health Care System Distrust Scale, Psychological Sense of Economic Hardship Scale) and the dependent variable (Symptoms Distress Scale). They identified that the Symptom Distress Scale was limited in scope and a single measure of distress in women with breast cancer.
Mazanec, S. R., Park, S., Connolly, M. C., & Rosenzweig, M. Q. (2021). Factors associated with symptom distress in women with breast cancer prior to initiation of chemotherapy. Applied Nursing Research, 62, 151515. https://doi.org/10.1016/j.apnr.2021.151515
This chapter is intended to introduce the essentials of measurement, including the definition of variables and data; different levels of measurement, reliability, and validity of the measurements; and how they influence the quality of a study by promoting internal and external validity.
Variables are the characteristics or traits that vary, and data are the values of variables. There are four levels of data: nominal, ordinal, interval, and ratio. Nominal and ordinal data are both made up of categorical/discrete variables; however, ordinal data have ranking or ordering between/among those categories, whereas nominal data do not. Interval and ratio data are generated from continuous variables with equal distance between intervals, but only ratio data have a meaningful zero and allow for a proportionate understanding of the measure.
Reliability and validity may be thought of as the consistency and accuracy of any given tool or instrument for measuring variables. Reliability and validity of measures influence a study's internal validity (strength of the relationship between independent and dependent variables) and external validity (ability to generalize from sample to population).
What is the difference between an independent variable and a dependent variable? Give examples of each.
Imagine you are to conduct a study on how weight and age group (18-35, 36-53, and ≥ 54) relate to systolic blood pressure. What are the variables in this study? Characterize each variable in terms of discrete vs. continuous, qualitative vs. quantitative, independent vs. dependent, and level of measurement.
What are some ways to improve reliability and validity?
Case study: From the following abstract, identify the population, probable sample type, independent and dependent variables, and level of measurement for each variable.
Good cognitive function is essential for patients with heart failure to effectively manage their disease. While many patients with heart failure have mild to moderate cognitive dysfunction, it is unclear what factors contribute to a decrease in their cognition. Sargent, et al. (2020) explored the relationship between physiological factors, psychosocial factors, and drug toxicities in a convenience sample of 113 patients with heart failure (HF) and cognitive decline.
Methods: We examined the influence of physiological factors (NYHA functional class II - IV, ejection fraction, co-morbidity burden, polypharmacy), psychosocial factors (anxiety, depression, evaluation for advanced therapy), and associated toxicities (anticholinergic drug burden), on cognitive dysfunction. Data were analyzed using mean (SE) for continuous variables and frequency and percent for categorical variables. Differences between NYHA functional classification (Class II vs. Class III/IV) were examined using Chi Square.
Further investigation of these variables was accomplished using linear regression models. The researchers found more cognitive dysfunction in patients with New York Heart Association (NYHA) Class III-IV HF than in Class II (p < 0.0001). Additionally, patients with a higher NYHA Class experienced a reduced ejection fraction (p = 0.041), more anxiety (p = 0.002), and more depression (p = 0.003). Most patients had a moderate anticholinergic drug burden. A higher medication count was discovered in NYHA Class III-IV versus Class II patients (p = 0.034). Findings from the regression analysis established that NYHA Class III-IV, anxiety, depression, and anticholinergic drug burden significantly influenced cognitive function of these HF patients.
Modified from Sargent, L., Flattery, M., Shah, K., Price, E. T., Tirado, C., Oliveira, T., Salyer, J. (2020). Influence of physiological and psychological factors on cognitive dysfunction in heart failure patients. Applied Nursing Research, 56, 151375. https://doi.org/10.1016/j.apnr.2020.151375
Case study: From the following abstract, identify the population, probable sample type, independent and dependent variables, and level of measurement for each variable.
Population: Patients with heart failure
Sample type: Convenience sample
Independent variables and levels of measurement
NYHA II-IV classification and EF (%), Ordinal and Ratio
Hospital Anxiety and Depression Scale, Ordinal for individual Likert item, interval for score
Anticholinergic Cognitive Burden Scoring Scale, Ordinal for individual Likert item, interval for score
Dependent variable and levels of measurement
MOS Cognitive Function Scale, Ordinal for individual Likert item, interval for score
True or False: The length of time in minutes that a patient waits to be called at a hospital is an interval level of measurement.
True or False: An investigator asks a patient participant at a local hospital to rate the service as outstanding, good, fair, poor, or very poor. These data are measured on an ordinal level of measurement.
Which of the following is an example of a continuous variable?
ZIP code
Gender
Income
Profit vs. nonprofit nursing home
True or False: An instrument can be valid without being reliable.