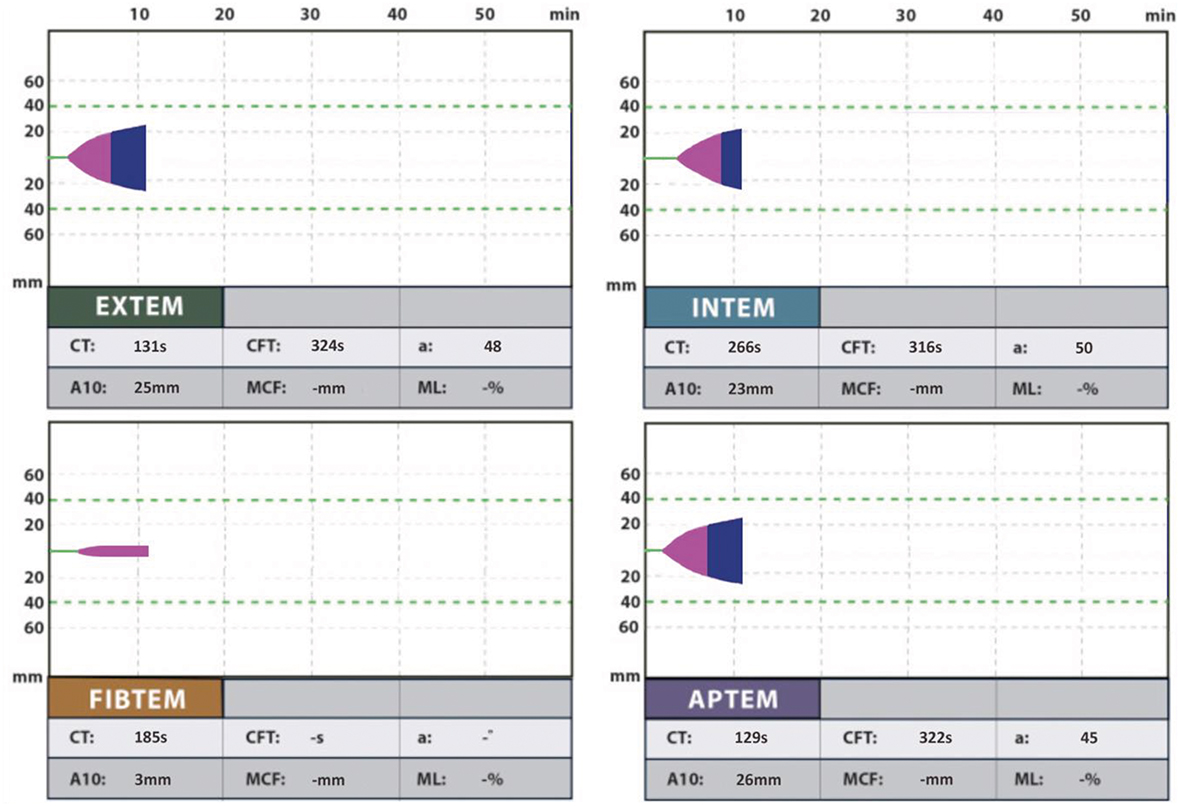
B.9. A rotational thromboelastometry was performed, and a 10-minute analysis reveals the following results (see Figure 12.9 and Table 12.8). How do you interpret this information?
Answer:
Table 12.8: Rotational Thromboelastometry Data for Section B.9
| Parameters | Patient Data | Reference Range | Parameters | Patient Data | Reference Range |
|---|---|---|---|---|---|
| EXTEM | INTEM | ||||
| CT (s) | 131 | 38-79 | CT (s) | 266 | 100-240 |
| CFT (s) | 324 | 34-159 | CFT (s) | 316 | 30-110 |
| α(degrees) | 48 | 63-83 | α(degrees) | 50 | 70-83 |
| A10 (mm) | 25 | 43-65 | A10 (mm) | 23 | 44-66 |
| FIBTEM | APTEM | ||||
| CT (s) | 185 | N/A | CT (s) | 129 | 38-79 |
| A10 (mm) | 3 | 7-23 | CFT (s) | 322 | 34-159 |
| α(degrees) | 45 | 63-83 | |||
| A10 (mm) | 26 | 43-65 | |||
References ranges are for ROTEM delta assays performed in European clinical reference laboratories in healthy adult population samples.
A10, amplitude 10 min; CFT, clot formation time; CT, clotting time; N/A, not available.
Figure 12.9.: Rotational Thromboelastometry Viscoelastic Assay Data.

Rotational thromboelastometry viscoelastic assay data. See Section B.9.
There are significant derangements across the EXTEM, INTEM, FIBTEM, and APTEM assays. The EXTEM and INTEM clotting time are prolonged, which occurs in the presence of low coagulation factors (ie, usually <30% of normal levels). The EXTEM and INTEM A10 are decreased, indicating inadequate clot firmness. This can be due to a lack of platelets or fibrinogen. Because the FIBTEM A10 is also decreased, fibrinogen deficiency is implicated. Platelet deficiency or dysfunction might coexist, as the EXTEM and INTEM A10 are below the lower reference range, and platelet function contributes ~80% of clot amplitude. The APTEM does not significantly differ from EXTEM, which suggests that hyperfibrinolysis is unlikely. However, fibrinolysis might not be apparent at 10 minutes. The assays should continue running for at least 30 minutes to more fully assess hyperfibrinolysis.
References
- Selby R. "TEG talk": expanding clinical roles for thromboelastography and rotational thromboelastometry. Hematology Am Soc Hematol Educ Program. 2020;2020:67-75.
- Whiting D, DiNardo JA. TEG and ROTEM: technology and clinical applications. Am J Hematol. 2014;89:228-232.


