


A.7. What are the three TEE vantage points for comprehensive imaging of the LV? How are pressure gradients measured by echocardiography? How do pressure gradients derived from Doppler echocardiography differ from those obtained in the catheterization laboratory by direct pressure measurement?
Answer:
The heart has two main axes: the longitudinal axis running from the base to the apex and the short axis (SAX) perpendicular to that. Multiple scan planes are required to completely image a 3D structure, such as the heart. The LV is divided into 17 segments: 6 at the basal level, 6 at the midpapillary level, 4 at the apical level, and 1 apical cap (Figure 7.13). By moving the TEE probe in the esophagus and rotating the crystal within the transducer tip, the LV can be comprehensively imaged. Normal ventricular motion requires that each wall segment thickens and moves toward the left ventricular cavity at systole. Segmental wall function is usually quantified as normal, hypokinesis, akinesis, or dyskinesis.
Figure 7.13.: Wall Segments of the LV.
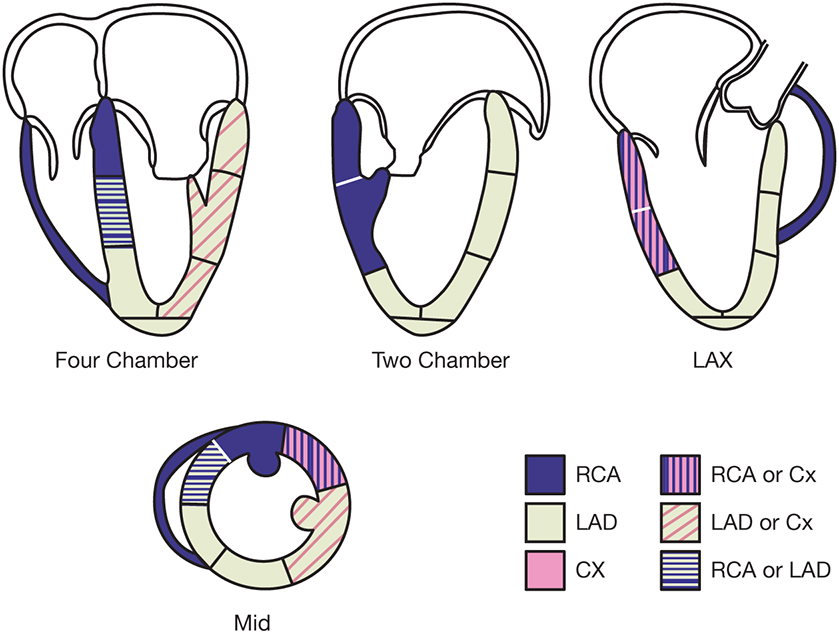
Wall segments of the LV. CX, circumflex; LAD, left anterior descending; LAX, long axis; LV, left ventricle; RCA, right coronary artery. (Reprinted from Lang RM, Bierig M, Devereux RB, et al. Recommendations for chamber quantification: a report from the American Society of Echocardiography's Guidelines and Standards Committee and the Chamber Quantification Writing Group, developed in conjunction with the European Association of Echocardiography, a branch of the European Society of Cardiology. J Am Soc Echocardiogr. 2005;18:1440-1463. Copyright © 2005 American Society of Echocardiography. With permission.)
In addition to function, TEE permits the determination of wall thickness and chamber size, important parameters in understanding the pathophysiology of valvular heart disease.
Pressure gradients are derived through analysis of the Doppler profiles of blood flow. A commonly determined echocardiography gradient is that from the LV to the aorta in the setting of AS. To obtain the change in blood flow velocity across the AV with TEE, the probe is advanced far into the stomach and sharply anteflexed and left deflected to obtain the window from the apex of the heart (deep transgastric long axis [LAX]) and align the ultrasound beam most parallel to the path of blood flow. From this window, the continuous-wave Doppler cursor is directed across the left ventricular outflow tract (LVOT) and AV. An example of such a spectral Doppler display is seen in Figure 7.14. The large increase in blood flow velocity in this display occurs at the narrowest point along its path, which, in this case, is the stenosed orifice of the AV. Using the modified Bernoulli equation, a gradient is calculated (100 mm Hg in the example). This represents the maximum instantaneous systolic pressure difference between the LV and the aorta. AS is also quantified at the time of catheterization by measuring the pressures from within the LV and the aorta as a rapid response pressure transducer catheter is withdrawn from the LV back to the aorta across the stenotic valve. The standard pressure gradient from direct measurements is the difference between the maximum LV and aorta pressures, or "peak-to-peak" gradient. Figure 7.15 illustrates that these peaks are not simultaneous events. Therefore, Doppler-derived AS gradients are usually higher than those derived by left heart catheterization.
Figure 7.14.: Continuous-Wave Doppler Across the Aortic Valve in the Deep Transgastric Apical View from a Patient with Severe Aortic Stenosis.
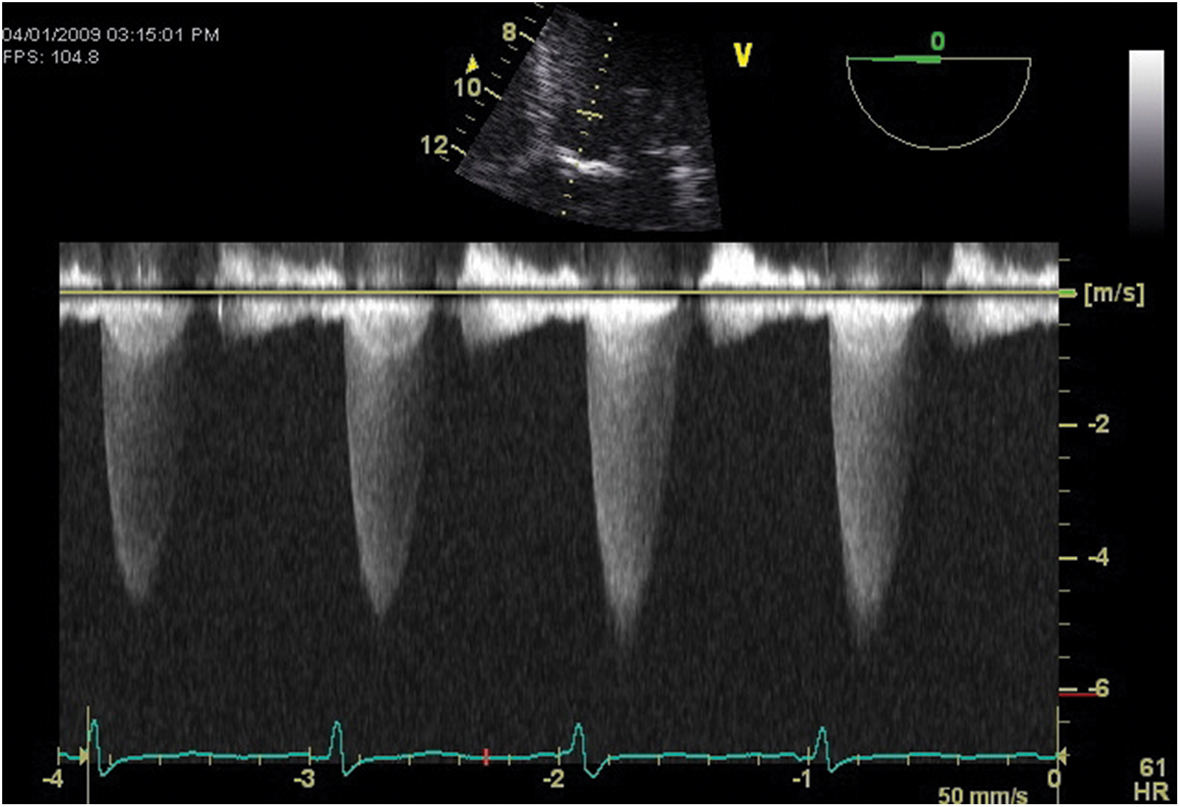
Continuous-wave Doppler across the aortic valve in the deep transgastric apical view from a patient with severe aortic stenosis.
Figure 7.15.: Pressure Gradients in Severe Aortic Stenosis are Measured during Systole as the Difference Between Aortic and Left Ventricular Pressures Displayed Using a Scale of 0 to 20 Mm Hg.
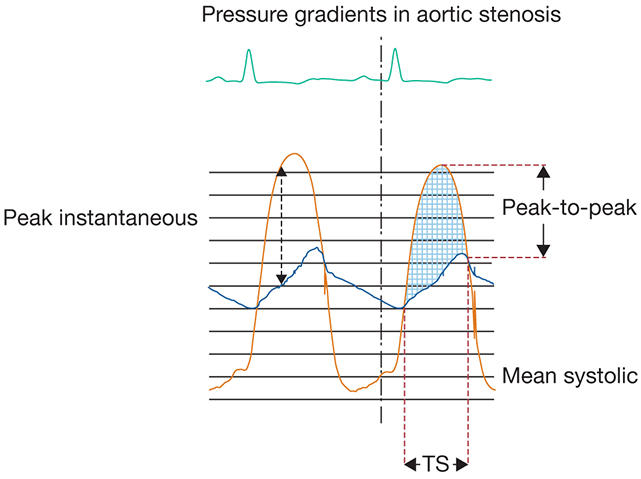
Pressure gradients in severe aortic stenosis are measured during systole as the difference between aortic and left ventricular pressures displayed using a scale of 0 to 20 mm Hg. The peak instantaneous gradient is the maximum gradient noted; the peak-to-peak gradient is the difference between peak left ventricular and aortic pressures. The mean systolic gradient is the average of all systolic pressure gradients noted during systolic ejection (TS). (Adapted with permission from Nanda NC, ed. Doppler Echocardiography. Lea & Febiger; 1993:130.)
References
- Hahn RT, Abraham T, Adams MS, et al. Guidelines for performing a comprehensive transesophageal echocardiographic examination: recommendations from the American Society of Echocardiography and the Society of Cardiovascular Anesthesiologists. J Am Soc Echocardiogr. 2013;26:921-964.
- Nicoara A, Skubas N, Ad N, et al. Guidelines for the use of transesophageal echocardiography to assist with surgical decision-making in the operating room: a surgery-based approach: from the American Society of Echocardiography in collaboration with the Society of Cardiovascular Anesthesiologists and the Society of Thoracic Surgeons. J Am Soc Echocardiogr. 2020;33:692-734.
- Otto CM. Transesophogeal echocardiography. In: Otto CM, ed. Textbook of Clinical Echocardiography. 6th ed. Elsevier; 2018:67-95.