A Look at an ECG Complex
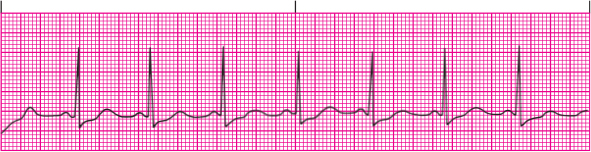
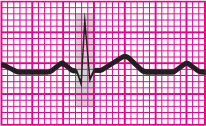
An ECG complex represents the electrical events occurring in one cardiac cycle. A complex consists of five waveforms labeled with the letters P, Q, R, S, and T. The middle three letters—Q, R, and S—are referred to as a unit, the QRS complex. ECG tracings represent the conduction of electrical impulses from the atria to the ventricles. (See Normal ECG)
The P Wave

The P wave is the first component of a normal ECG waveform. It represents atrial depolarization—conduction of an electrical impulse through the atria. When evaluating a P wave, look closely at its characteristics, especially its location, amplitude, duration, configuration, and deflection. In a normal ECG, there should be one P wave, which precedes the QRS complex and has the following characteristics:
- Location: Precedes the QRS complex
- Amplitude: <0.25 mV (2.5 mm or 2.5 small squares high)
- Duration: <0.12 second (three small squares in length; each horizontal square equals 0.04 second)
- Configuration: usually rounded and upright
- Deflection: Positive or upright in leads I, II, aVF, and V2 to V6; usually positive but variable in leads III and aVL; negative or inverted in lead aVR; biphasic or variable in lead V1.
If the deflection and configuration of a P wave are normal—for example, if the P wave is upright in lead II and is rounded and smooth—and if one P wave precedes each QRS complex, you can assume that this electrical impulse originated in the sinoatrial (SA) node of the right atrium. Electrical activity of the myocardium precedes muscular contraction. Therefore, the atria contract partway through the P wave and is not recorded on the ECG. Remember, the ECG records only electrical activity and precedes mechanical activity or contraction.
The Odd Ps
The configuration and amplitude of the P wave are important to note. When a P wave has an amplitude of less than 2.5 mm in lead II or less than 1.5 mm in V1, right atrial enlargement may be indicated. A prolonged P wave, that is greater than or equal to 0.12 second, in the frontal plan (such as lead II) can suggest left atrial enlargement. Other conditions associated with peaked, notched, or enlarged P waves include chronic obstructive pulmonary disease, pulmonary emboli, valvular disease, or heart failure.
Recall that the SA node, pacemaker of the heart, is located in the right atrium and generates electrical impulses that are relayed to the atrioventricular (AV) node, whereas the AV node is located in the posterior-inferior region of the interatrial septum and travel to the ventricles, lower chambers of the heart. Inverted P waves may signify retrograde atrial depolarization or reverse conduction from the AV junction toward the atria. If the P wave has flipped on a repeat ECG, an upright sinus P wave becomes inverted, consider retrograde or reverse conduction as possible conditions.
Varying P waves indicate that the impulse may be generated from different sites, as with a wand ering pacemaker rhythm, irritable atrial tissue, or damage near the SA node. Absent P waves may signify conduction by a route other than the SA node, as with a junctional rhythm, such as atrial flutter or fibrillation. In some cases, absent P waves may be caused by hyperkalemia. A flattened baseline with absent or numerous erratic P waves may indicate rapid atrial contraction caused by rhythm disturbances, such as atrial flutter or fibrillation. In atrial flutter, although P waves are not distinct, a saw-toothed flutter wave(s) is apparent on the ECG.
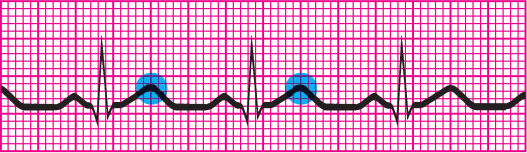
The Pr Interval

The PR interval is measured on the horizontal axis of the ECG from the beginning of the P wave to the beginning of the adjacent QRS interval. The PR interval tracks the atrial impulse from the atria through the AV node, bundle of His, and right and left bundle branches. When evaluating a PR interval, note duration. Changes in the PR interval indicate an altered impulse formation or a conduction delay, as seen in AV block. Although the amplitude, configuration, and deflection of the PR interval are not measured, it is important to note the following characteristics:
- Location: From the beginning of the P wave to the beginning of the QRS complex
- Duration: 0.12 to 0.20 second (three to five small squares in length; each horizontal square equals 0.04 second).
These characteristics are different for pediatric patients. (See Pediatric rates and intervals)
The Short and Long of It
Short PR intervals (<0.12 second) indicate that the impulse originated somewhere other than the SA node. This variation is associated with junctional arrhythmias and pre-excitation syndromes. Prolonged PR intervals (>0.20 second), slowing through the atria or AV junction, represent a conduction delay because of digoxin toxicity, heart block, or myocardial ischemia/infarction associated with heart injury or damaged heart tissue.
The QRS Complex
The QRS complex that follows the P wave represents ventricular depolarization and contraction and is also known as ventricular systole. At this time, the atria repolarize and relax. The impulse is transmitted from the AV node to the bundle of His and Purkinje fibers located in the ventricular walls. Ventricular contraction proceeds from the apex of the heart to its base and results in blood being ejected from the ventricles through the semilunar valves (aortic and pulmonary) into the arterial system perfusing the body with oxygenated blood and creating a pulse.
Not Necessarily Mechanical
The ECG waveform represents only electrical activity of the heart. Remember that mechanical contraction of heart and its contents follows electrical conduction, but is not a guarantee of successful perfusion. When monitoring the cardiac rhythm, it is important to remember that proper assessment of the patient includes other clinical indicators to determine health and stability. Muscular contraction of the heart can be weak and ineffective in perfusing the body, as may occur with premature ventricular contractions, or pulse may be absent, as with pulseless electrical activity. Always check the patient’s physiological status (including pulse, blood pressure, and mentation) when performing ECG monitoring.
It’s All Normal
Pay special attention to the duration and configuration when evaluating a QRS complex. A normal complex has the following characteristics:
- Location: Follows the PR interval
- Amplitude: 5 to 30 mV (1 mm or six small squares high) but differs for each lead used
- Duration: 0.06 to 0.12 second (1.5 to 3 small squares in length; each horizontal square equals 0.04 second), or roughly half of the PR interval. Duration is measured from the beginning of the Q wave to the end of the S wave or from the beginning of the R wave if the Q wave is absent.
- Configuration: Consists of the Q wave (the first negative deflection after the P wave), the R wave (the first positive deflection after the P wave or the Q wave), and the S wave (the first negative deflection after the R wave). All three waves may not always be evident on the ECG. The ventricles depolarize quickly, minimizing the contact time between the stylus and the ECG paper, so the QRS complex typically appears thinner than other ECG components. QRS complexes may also appear differently in each lead. (See QRS waveform variety)
- Deflection: Positive in leads I, II, III, aVL, aVF, and V4 to V6 and negative in leads aVR and V1 to V3.
Crucial I.D.
Remember that the QRS complex represents intraventricular conduction time. That is why identifying and correctly interpreting this waveform is so crucial. If no P wave appears before the QRS complex, consider that the impulse may have originated in the AV node or bundle of His such as a junctional rhythm or in the ventricles, indicating a ventricular arrhythmia. (See Older adult ECGs.)
| Ages and stages |
 Older adult ECGs Older adult ECGsAlways keep the patient’s age in mind when interpreting the ECG. ECG changes in the older adult include increased PR, QRS, and QT intervals, decreased amplitude of the QRS complex, and a shift of the QRS axis to the left. |
Deep and Wide
Deep, wide Q waves may represent myocardial infarction. In this case, the Q-wave amplitude is 25% of the R-wave amplitude, or the duration of the Q wave is 0.04 second. A notched R wave may signify a bundle-branch block. A widened QRS complex (>0.12 second) may signify a ventricular conduction delay. Missing QRS complexes may indicate AV block or ventricular stand still.
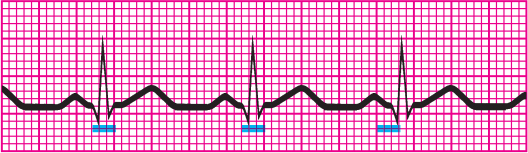
The ST Segment

The ST segment represents the end of ventricular depolarization or conduction and the beginning of ventricular repolarization or recovery. The flat, isoelectric portion of the ECG that occurs at the end of the S wave to the beginning of the T wave is known as the ST segment. The point that marks the end of the QRS complex and the beginning of the ST segment is known as the J point.
Normal ST
Pay special attention to the deflection of an ST segment. A normal ST segment has the following characteristics:
- Location: Extends from the S wave to the beginning of the T wave
- Deflection: Usually isoelectric (neither positive nor negative); may vary from –0.5 to +1 mm in some precordial leads.
Not So Normal ST
A change in the ST segment may indicate myocardial ischemia or infarction. An ST segment may become either elevated or depressed. Observe the ST segment for characteristic patterns of depression changes known as upsloping, downsloping, or horizontal. (See Changes in the ST segment.)
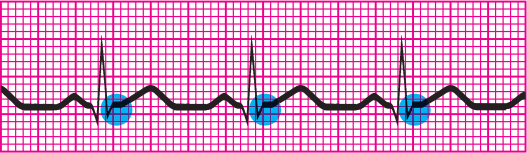
The T Wave
The T wave represents ventricular repolarization or recovery. When evaluating a T wave, look at the amplitude, configuration, and deflection. Normal T waves have the following characteristics (duration isn’t measured):
- Location: Follows the S wave
- Amplitude: 0.5 mm in leads I, II, and III and up to 10 mm in the precordial leads
- Configuration: Typically round and smooth
- Deflection: Usually upright in leads I, II, and V3 to V6; inverted in lead aVR; variable in all other leads.
Why is that T So Bumpy?
The T wave may be asymmetrical, and the first slope may appear more gradual than the second one. The T wave’s peak represents the relative refractory period of ventricular repolarization, a period during which cells are especially vulnerable to extra stimuli. Bumps in a T wave may indicate that a P wave is hidden in it. If a P wave is hidden, atrial depolarization has occurred, the impulse having originated at a site above the ventricles.

Tall, Inverted, or Pointy Ts
The amplitude of the T wave typically corresponds to the amplitude of the preceding R wave. T waves may appear taller in leads V3 and V4. Tall, peaked, or tented T waves indicate myocardial ischemia or hyperkalemia. Inverted T waves in leads I, II, or V3 through V6 may represent myocardial ischemia. Heavily notched or pointed T waves in an adult may suggest pericarditis.
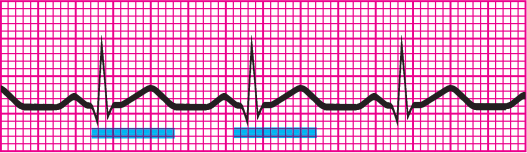
The QT Interval
The QT interval measures ventricular depolarization and repolarization. The length of the QT interval varies according to heart rate. The faster the heart rate, the shorter the QT interval. When checking the QT interval, look closely at the duration.
A normal QT interval has the following characteristics (amplitude, configuration, and deflection aren’t observed):
- Location: Extends from the beginning of the QRS complex to the end of the T wave
- Duration: Varies according to age, sex, and heart rate; usually lasts from 0.36 to 0.44 second; should not be greater than half the distance between consecutive R waves (R to R interval) when the rhythm is regular.
The Importance of QT
The QT interval shows the time needed for the ventricular depolarization–repolarization cycle. An abnormality in duration may indicate myocardial problems. Prolonged QT intervals indicate that the relative refractory period is longer. A prolonged QT interval increases the risk of a life-threatening arrhythmia known as torsades de pointes.
This variation is also associated with certain medications such as Class IA antiarrhythmics. (See Drugs that increase the QT interval.) Prolonged QT syndrome is a congenital conduction-system defect present in certain families. Short QT intervals may result from digoxin toxicity or hypercalcemia.
The U Wave
The U wave represents the recovery period of the Purkinje or ventricular conduction fibers. It is seen as a small deflection following the T wave; however, is not present on every rhythm strip. The configuration is the most important characteristic of the U wave.
When present, a normal U wave has the following characteristics (amplitude and duration aren’t measured):
- Location: Follows the T wave
- Configuration: Typically upright except in aVR, and rounded
- Deflection: Upright.
The U wave may not appear on an ECG. A prominent U wave may be because of hypercalcemia, hypokalemia, or digoxin toxicity.
8-Step Method
Interpreting a rhythm strip is a skill developed through practice. You can use several methods, as long as you employ consistent technique. Rhythm strip analysis requires a sequential and systematic approach, such as the eight steps outlined here.
Step 1: Determine the Rhythm
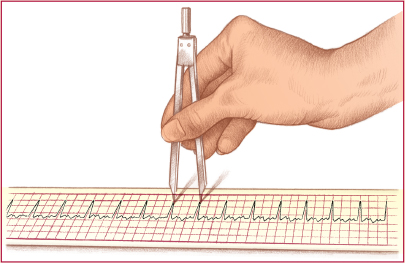
To determine the heart’s atrial and ventricular rhythms, use either the paper-and -pencil method or the caliper method. (See Methods of measuring rhythm.)
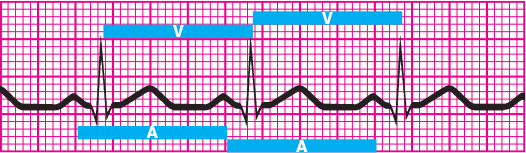
For atrial rhythm, measure the P-P intervals—the intervals between consecutive P waves. These intervals should occur regularly with only small variations associated with respirations. Then compare the P-P intervals in several cycles. Consistently similar P-P intervals indicate regular atrial rhythm; dissimilar P-P intervals indicate irregular atrial rhythm.
To determine the ventricular rhythm, measure the intervals between two consecutive R waves in the QRS complexes. If an R wave isn’t present, use the Q wave of consecutive QRS complexes. The R-R intervals should occur regularly.
Then compare R-R intervals in several cycles. As with atrial rhythms, consistently similar intervals mean a regular rhythm; dissimilar intervals point to an irregular rhythm.
Ask yourself: How irregular is the rhythm? Is it slightly irregular or markedly so? Does the irregularity occur in a pattern (a regularly irregular pattern)? Keep in mind that variations of up to 0.04 second are considered normal.
Step 2: Determine the Rate
You can use one of three methods to determine an approximate atrial and ventricular heart rate. Always check a pulse to correlate it with the heart rate on the ECG.
The easiest way to calculate heart rate is the 10-times method, especially if the rhythm is irregular. You’ll notice that ECG paper is marked in increments of 3 seconds, or 15 large boxes. To figure the atrial rate, obtain a 6-second strip, count the number of P waves, and multiply by 10. Ten 6-second strips represent 1 minute. Calculate ventricular rate the same way, using the R waves.
If the heart rhythm is regular, use the 1,500 method—so named because 1,500 small squares represent 1 minute. Count the small squares between identical points on two consecutive P waves and then divide 1,500 by that number to get the atrial rate. To obtain the ventricular rate, use the same method with two consecutive R waves.
The third method of estimating heart rate is the sequence method, which requires that you memorize a sequence of numbers. (See Calculating heart rate.) To get the atrial rate, find a P wave that peaks on a heavy black line and assign the following numbers to the next six heavy black lines: 300, 150, 100, 75, 60, and 50. Then find the next P wave peak and estimate the atrial rate, based on the number assigned to the nearest heavy black line. Estimate the ventricular rate the same way, using the R wave.
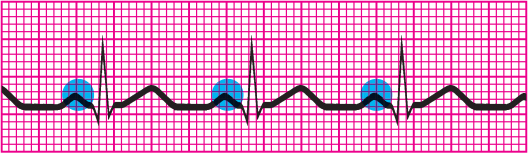
Step 3: Evaluate the P Wave
When examining a rhythm strip for P waves, ask yourself: Are P waves present? Do they all have normal configurations? Do they all have a similar size, shape, and location on the ECG? Is there one P wave preceding every QRS complex?
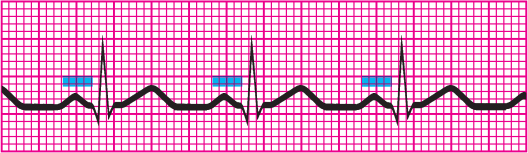
Step 4: Determine the Duration of the Pr Interval
To measure the PR interval, count the small squares between the start of the P wave and the start of the QRS complex; then multiply the number of squares by 0.04 second. Now ask yourself: Is the duration a normal 0.12 to 0.20 second? Is the PR interval constant?
Step 5: Determine the Duration of the QRS Complex
When determining QRS duration, be sure to measure straight across from the end of the PR interval to the end of the S wave, not just to the peak. Remember, the QRS has no horizontal components. To calculate duration, count the number of small squares between the beginning and end of the QRS complex and multiply this number by 0.04 second. Then ask yourself: Is the duration a normal 0.06 to 0.12 second? Are all QRS complexes the same size and shape? (If not, measure each one and describe it individually.) Does a QRS complex appear after every P wave?

Step 6: Evaluate the T Waves
Examine the strip for T waves. Then ask yourself: Are T waves present? Do they all have a normal shape? Do they all have a normal amplitude? Do they all have the same amplitude? Do the T waves have the same deflection as the QRS complexes?
Step 7: Determine the Duration of the QT Interval
Count the number of small squares between the beginning of the QRS complex and the end of the T wave, where the T wave returns to the baseline. Multiply this number by 0.04 second. Ask yourself: Is the duration a normal 0.36 to 0.44 second? (See Correcting the QT interval.)
Step 8: Evaluate Any Other Components
Check for ectopic beats and other abnormalities. Also check the ST segment for abnormalities, and look for the presence of a U wave. Note your findings, and then interpret them by naming the rhythm strip according to one or all of these findings:
- origin of the rhythm (e.g., sinus node, atria, AV node, or ventricles)
- rate characteristics (e.g., bradycardia or tachycardia)
- rhythm abnormalities (e.g., flutter, fibrillation, heart block, escape rhythm, or other arrhythmias).
Recognizing Normal Sinus Rhythm
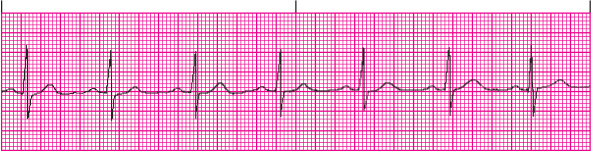
Before you can recognize an arrhythmia, you must first be able to recognize normal sinus rhythm. Normal sinus rhythm records an impulse that starts in the sinus node and progresses to the ventricles through a normal conduction pathway—from the sinus node to the atria and AV node, through the bundle of His, to the bundle branches, and on to the Purkinje fibers. Normal sinus rhythm is the stand ard against which all other rhythms are compared. (See Normal sinus rhythm.)
What Makes for Normal?
Using the 8-step method previously described, these are the characteristics of normal sinus rhythm:
- Atrial and ventricular rhythms are regular
- Atrial and ventricular rates fall between 60 and 100 beats/min, the SA node’s normal firing rate, and all impulses are conducted to the ventricles
- P waves are rounded, smooth, and upright in lead II, signaling that a sinus impulse has reached the atria
- The PR interval is normal (0.12 to 0.20 second), indicating that the impulse is following normal conduction pathways
- The QRS complex is of normal duration (<0.12 second), representing normal ventricular impulse conduction and recovery
- The T wave is upright in lead II, confirming that normal repolarization has taken place
- The QT interval is within normal limits (0.36 to 0.44 second)
- No ectopic or aberrant beats occur.
| That’s a wrap! |
 Rhythm strip interpretation review Rhythm strip interpretation reviewNormal P Wave
Normal Pr Interval
Normal QRS Complex
Normal ST Segment
Normal T Wave
Normal QT Interval
Normal U Wave
Interpreting a Rhythm Strip: 8-Step Method
Normal Sinus Rhythm Normal sinus rhythm is the stand ard against which all other rhythms are compared. Characteristics
|