


A.3. What are pressure-volume (P-V) loops? What do the different inflection points represent?
Answer:
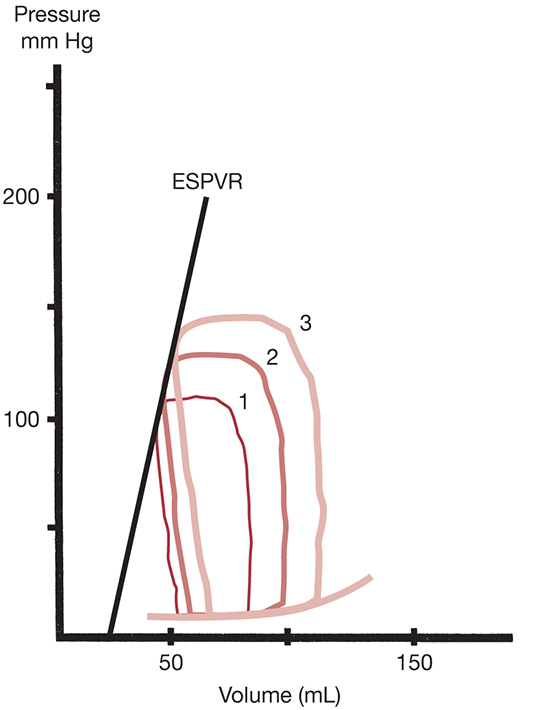
The P-V loop (Figure 7.1) depicts the relation between ventricular volume and pressure during a single cardiac cycle. Opening and closing of the MV and AV are represented by the inflection points A, B, C, and D, respectively (Figure 7.1). Moving from points A to D, AB depicts left ventricular filling, BC depicts isovolumetric contraction, CD shows left ventricular ejection, and DA shows isovolumetric relaxation. Point A coincides with opening of the MV and represents left ventricular end-systolic volume and early diastolic pressure. Point B is closure of the MV and the relationship of end-diastolic pressure (LVEDP) and volume (left ventricular end-diastolic volume [LVEDV]). Point C represents the opening of the AV and coincides with systemic, aortic diastolic pressure. Finally, point D is the closure of the AV and represents left ventricular end-systolic pressure (LVESP) and volume (LVESV), coinciding with the dicrotic notch in the aortic pressure tracing (Figure 7.1). Left ventricular compliance is the relation between pressure and volume and is defined by the slope of the filling phase (segment AB). Preload is the P-V relation before the onset of contraction (LVEDP). Contractility may be illustrated by the slope of the end-systolic pressure-volume relation (ESPVR). The ESPVR slope is created by connecting multiple points (D) from multiple P-V loops generated by changing the filling volume to the LV (Figure 7.2). Increased contractility results in a steeper slope, whereas diminished contractility results in a shallower slope. The P-V loop analysis permits illustration of stroke volume and ejection fraction. Stroke volume is defined as difference in volume from the end of filling to the end of ejection (EDV-ESV), whereas the ejection fraction is the ratio of stroke volume to total volume in the heart at peak filling (SV/EDV). Therefore, the P-V loop analysis permits illustration of the volume-pressure relations and their changes with each of the four valvular lesions.
Figure 7.1.: Normal P-V Loop and Valve Positions.
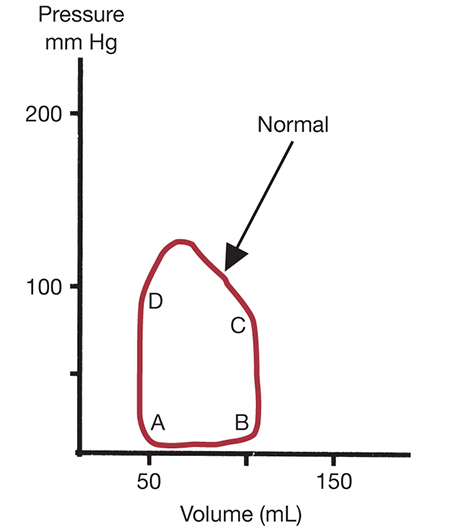
Normal P-V loop and valve positions. A, mitral valve (MV) opening; AB, left ventricular filling; B, MV closure; BC, isovolumetric contraction; C, aortic valve (AV) opening; CD, ejection; D, AV closure; DA, isovolumetric relaxation.
References
- Bastos MB, Burkhoff D, Maly J, et al. Invasive left ventricle pressure-volume analysis: overview and practical clinical implications. Eur Heart J. 2020;41:1286-1297.
- Hsu S, Fang JC, Borlaug BA. Hemodynamics for the heart failure clinician: a state-of-the-art review. J Card Fail. 2022;28:133-148.
- Salgado BC, Bhimaraj A. Physiological concepts of cardiogenic shock using pressure-volume loop simulations: a case-based review. Methodist Debakey Cardiovasc J. 2020;16:43-49.