


A.4. What are representative P-V loops for the four valvular lesions?
Answer:
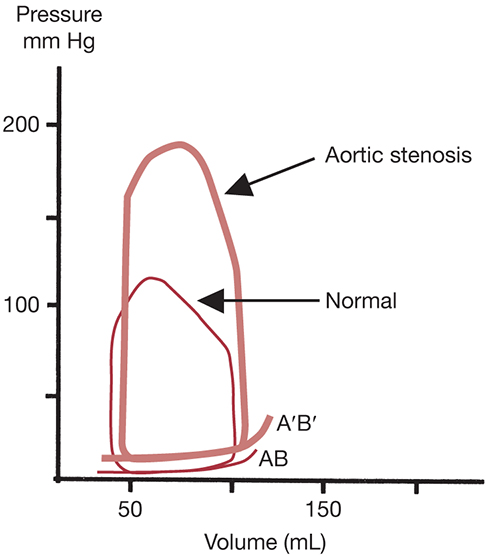
The hallmarks of AS, illustrated by the P-V loop analysis, are an increased left ventricular systolic pressure and an upward and counterclockwise rotation in the end-diastolic P-V relation (AB) indicative of decreased chamber compliance (Figure 7.3). Stroke volume and ejection fraction are well preserved, but the ejection phase of the loop occurs at much higher pressures. This is accomplished by an increase in contractility (counterclockwise rotation of the ESPVR).
The schematic P-V loop for chronic AI depicts an enlarged LV. The minimal change in LVEDP despite the large volume overload is seen by the shift in the diastolic P-V curve to the right (A B ) (Figure 7.4). Low systemic diastolic pressures result in a brief isovolumetric phase (B C ) and early complete ejection. The isovolumetric relaxation phase is absent because the incompetent valve permits regurgitant filling of the LV from the aorta during diastole even before opening of the MV. In contrast, when acute AI occurs, the left ventricular compliance is unchanged. Rapid increases in LVEDP from volume overload along the unshifted left ventricular diastolic P-V curve (A′B′) rapidly lead to increased left atrial pressure and pulmonary congestion.
Figure 7.4.: P-V Loops of Acute and Chronic Aortic Insufficiency (AI).
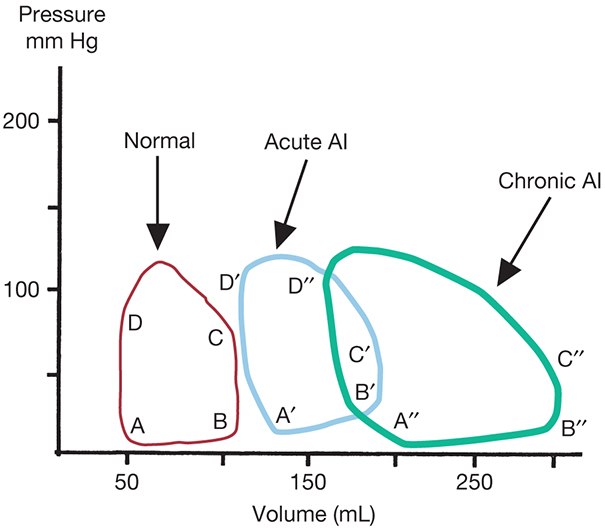
P-V loops of acute and chronic aortic insufficiency (AI).
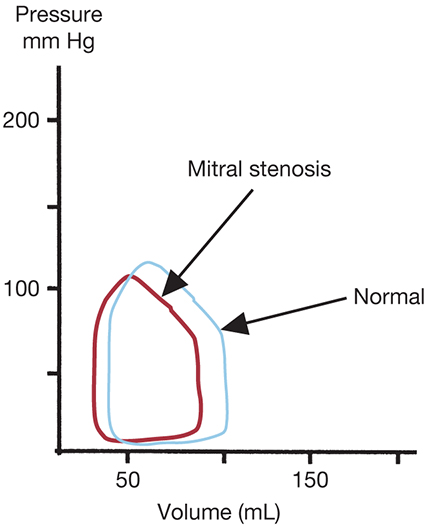
The P-V loop of MS illustrates hypovolemia, the cause of which cannot be determined from the loop alone (Figure 7.5). Because the predominant impact of MS occurs proximal to the LV, the P-V analysis format is less useful.
In MR, the diastolic P-V relation (line AB) is shifted to the right, as it is in chronic AI, consistent with a marked increase in compliance (Figure 7.6). The isovolumetric phase (BC) is nearly absent because the LA generally serves as a low-pressure/high-compliance route for ejection through an incompetent MV. Decreases in contractility are depicted by a decrease in the slope of the ESPVR (line through D).
Figure 7.6.: P-V Loop of Acute and Chronic Mitral Regurgitation (MR).

P-V loop of acute and chronic mitral regurgitation (MR).
References
- Bastos MB, Burkhoff D, Maly J, et al. Invasive left ventricle pressure-volume analysis: overview and practical clinical implications. Eur Heart J. 2020;41:1286-1297.
- Hsu S, Fang JC, Borlaug BA. Hemodynamics for the heart failure clinician: a state-of-the-art review. J Card Fail. 2022;28:133-148.
- Nishimura RA, Carabello BA. Hemodynamics in the cardiac catheterization laboratory of the 21st century. Circulation. 2012;125:2138-2150.