


A.5. Draw the pressure/time curves for the LV, left atrium (LA), pulmonary artery (PA), and aorta for a normal patient and for patients with each of the four valvular lesions.
Answer:
Normal curves are shown in Figure 7.7. The points A, B, C, and D correspond to the same points in the P-V loops.
Figure 7.7.: Pressure Curves for the LV, Left Atrium, Pulmonary Artery, and Aorta in a Healthy Individual.

Pressure curves for the LV, left atrium, pulmonary artery, and aorta in a healthy individual.
Aortic Stenosis
The additional systolic pressure work of AS can be seen in the left ventricular pressure tracing (Figure 7.8). Elevations in LVEDP (point B) can be seen to diminish the perfusion gradient for coronary flow to the LV. The augmentation in left ventricular filling late in diastole secondary to atrial contraction (left atrial "kick" from sinus rhythm) is highlighted in the inset. Rising left ventricular diastolic pressures secondary to decreased compliance necessitate elevations in left atrial pressures to permit complete left ventricular volume loading. Atrial systole provides this elevation in left atrial pressure synchronous with elevations in LVEDP while keeping left atrial pressures relatively low during the remaining cardiac cycle facilitating pulmonary venous drainage.
Figure 7.8.: Pressure Curves for the LV, Left Atrium (LA), Pulmonary Artery, and Aorta in Patients with Aortic Stenosis.
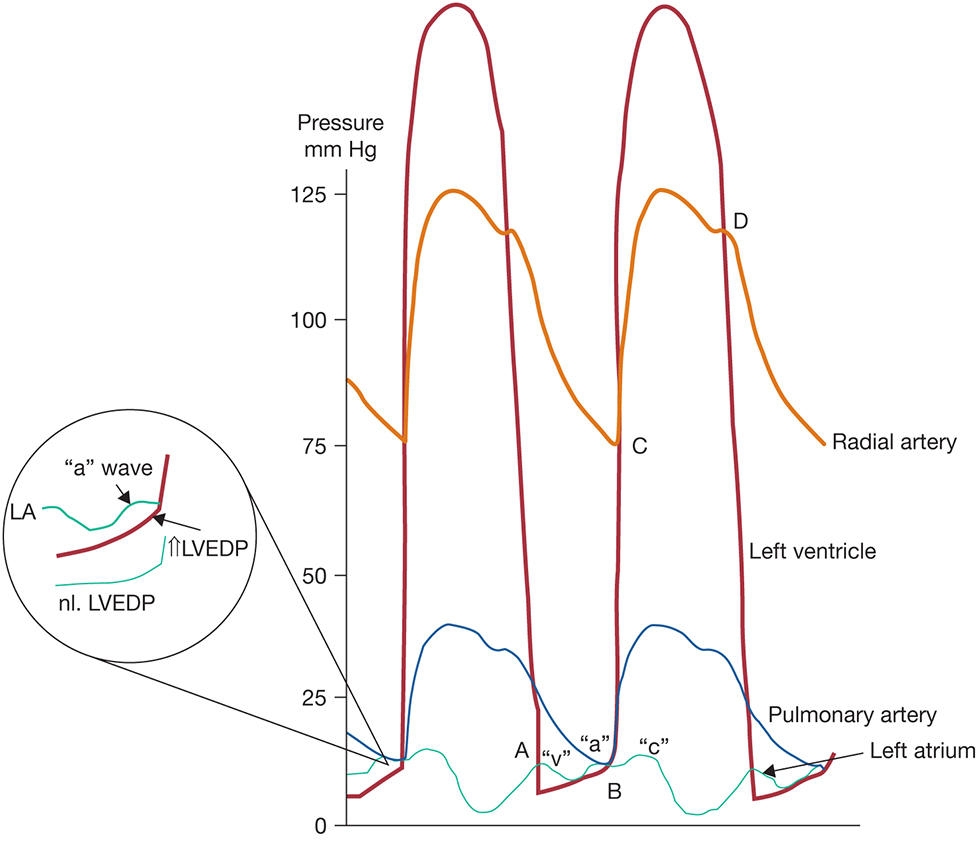
Pressure curves for the LV, left atrium (LA), pulmonary artery, and aorta in patients with aortic stenosis. LVEDP, left ventricular end-diastolic pressure.
Aortic Insufficiency
The rapid upstroke and rapid decline of arterial pressure indicate absence of AV closure and low end-diastolic aortic pressure (Figure 7.9). Elevations in LVEDV and LVEDP are typical of AI. The early increase in LVEDP can result in left ventricular pressures exceeding those of the LA during diastole, with resultant premature closure of the MV.
Figure 7.9.: Pressure Curves for the LV, Left Atrium, Pulmonary Artery, and Aorta in Patients with Aortic Regurgitation.
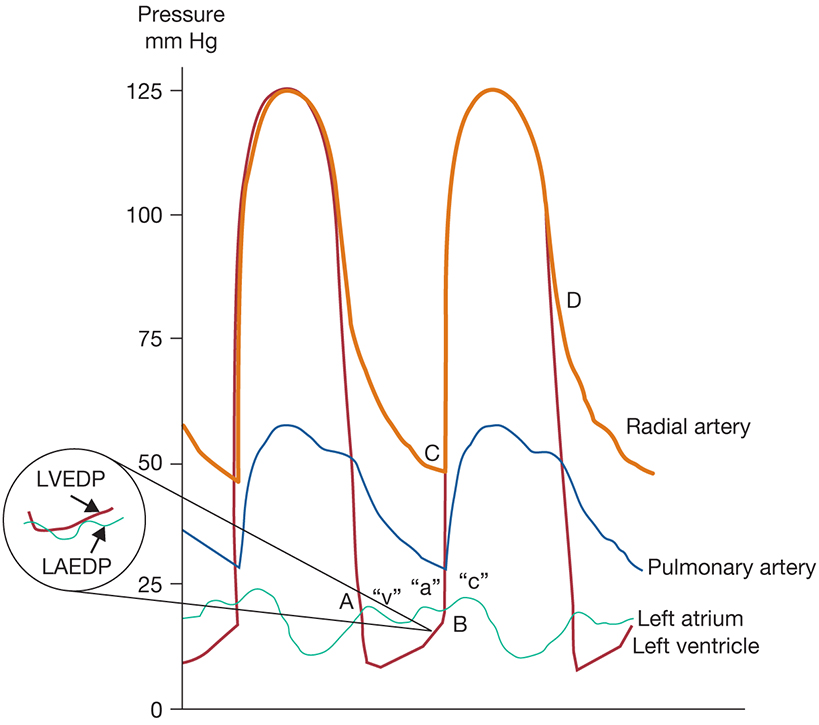
Pressure curves for the LV, left atrium, pulmonary artery, and aorta in patients with aortic regurgitation. LAEDP, left atrium end-diastolic pressure; LVEDP, left ventricular end-diastolic pressure.
Mitral Stenosis
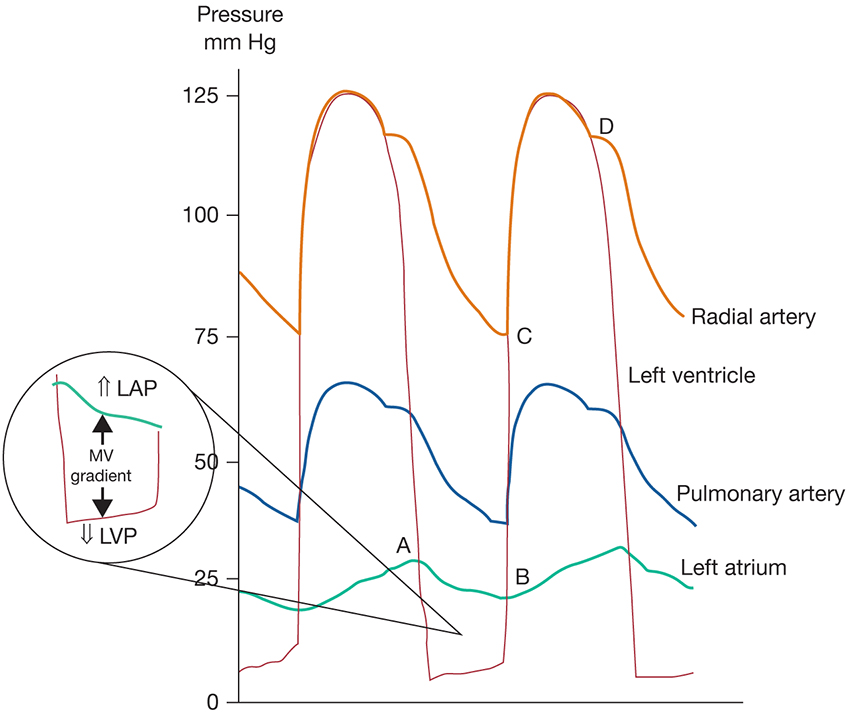
Elevations in pressure are seen in both the left atrial and PA tracing with MS (Figure 7.10). The large gradient between left atrial and left ventricular pressures is highlighted in the inset. Chronic elevation in pulmonary volume induces changes the pulmonary arterial vascular bed and results in pulmonary hypertension.
Mitral Regurgitation
The hallmark of MR is the marked elevations of left atrial pressure during systole and the occurrence of a giant "cv" wave and elevated PA pressures (Figure 7.11).
Figure 7.11.: Pressure Curves for the LV, Left Atrium, Pulmonary Artery, and Aorta in Patients with Mitral Regurgitation.
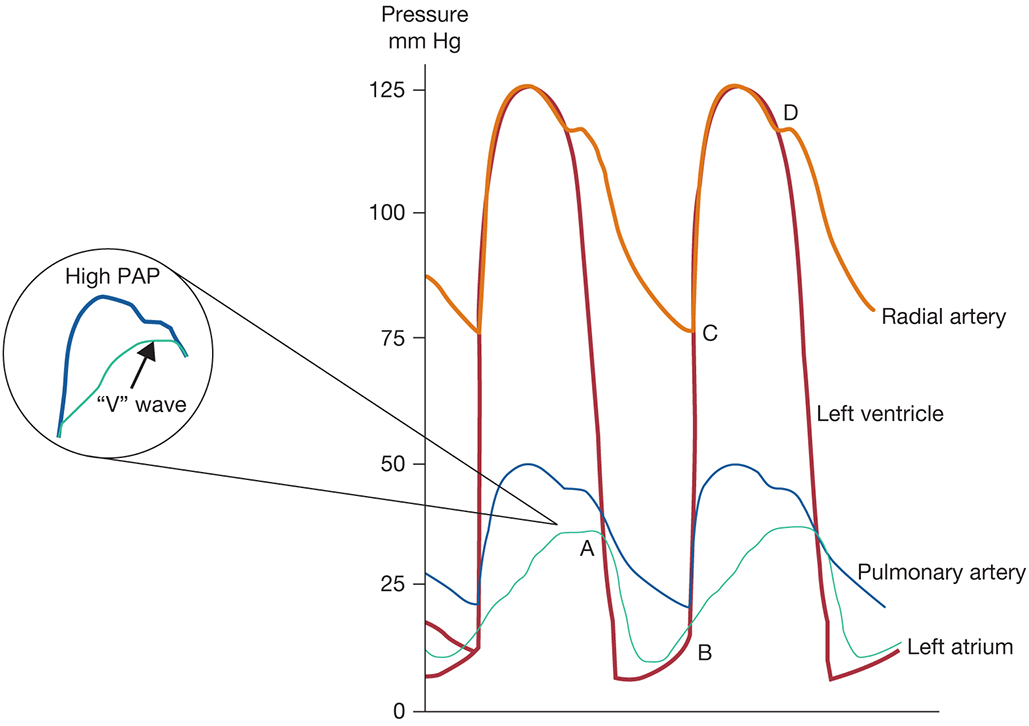
Pressure curves for the LV, left atrium, pulmonary artery, and aorta in patients with mitral regurgitation. PAP, pulmonary artery pressure.
References