A Look at 12-Lead ECG Interpretation
To interpret a 12-lead ECG, use the systematic approach outlined here. Compare the patient’s previous ECG, if available, with the current one to help you identify changes.
- Check the ECG tracing to ensure the baseline is free from electrical interference and drift.
- Lead aVR is typically negative. If it is not negative, the leads may be placed incorrectly.
- Locate the lead markers on the waveform. Lead markers are the points where one lead changes to another.
- Check the stand ardization markings to make sure all leads were recorded with the ECG machine’s amplitude at the same setting. Stand ardization markings are usually located at the beginning of the strip.
- Assess the heart rate and rhythm as you learned in earlier chapters.
- Determine the heart’s electrical axis. Use either the quadrant method or the degree method, described later in this chapter.
- Examine the limb leads: I, II, and III. The R wave in leads I and II should be dominant with upright P and T waves. The R wave in lead III may be dominant or absent, with upright, flat, or inverted P and T waves. Each lead should have flat ST segments and pathologic Q waves should be absent.
- Examine the augmented leads: aVL, aVF, and aVR. The tracings from leads aVL and aVF should be similar, but lead aVF should have taller P and R waves. Lead aVR has little diagnostic value. Its P wave, QRS complex, and T wave should be deflected downward.
- Examine the R wave in the precordial leads, V1 to V6. Normally, the R wave—the first positive deflection of the QRS complex—gets progressively taller from lead V1 to lead V5, then it gets slightly smaller in lead V6. (See R-wave progression.)
- Examine the S wave—the negative deflection after an R wave—in the precordial leads. It appears extremely deep in lead V1 and becomes progressively more shallow, usually disappearing at lead V5 or V6.

All About Waves
As you examine each lead, note where changes occur so you can identify the area of the heart that’s affected. Remember that P waves should be upright; however, they may be inverted in lead aVR or biphasic or inverted in leads III, aVL, and V1.
PR intervals should always be constant, just like QRS-complex durations. QRS-complex deflections will vary in different leads. Observe for pathologic Q waves. (See Normal findings in pediatric ECGs.)
Elevated One Minute, Depressed the Next

ST segments should be isoelectric or have minimal deviation. ST-segment elevation greater than 1 mm above the baseline and ST-segment depression greater than 0.5 mm below the baseline are considered abnormal. Leads facing an injured area will have ST-segment elevations, and leads facing away will display ST-segment depressions.
That Old, Changeable T Wave
The T wave should be slightly rounded and upright. It normally deflects upward in leads I, II, and V3 through V6. It may also be inverted in leads III, aVR, aVF, aVL, and V1. T waves should not be tall, peaked, or notched. There are numerous reasons for T-wave changes, which are not always cause for alarm. Excessively tall, flat, or inverted T waves or ST–T wave changes with accompanying cardiac symptoms, such as chest pain may indicate myocardial ischemia.
Split-Second Duration
A normal Q wave generally has a duration of less than 0.04 second. An abnormal Q wave has either a duration of 0.04 second or more, a depth greater than 4 mm, or a height one-fourth of the R wave.
Abnormal Q waves indicate myocardial necrosis. These waves develop when depolarization does not take its normal path because of damaged tissue in the area. Remember that lead aVR normally has a large Q wave, so disregard this lead when searching for abnormal Q waves.
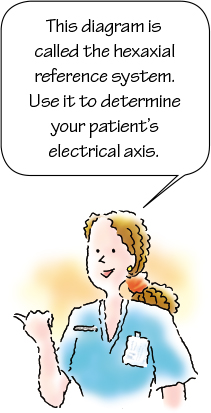
Finding the Electrical Axis
The electrical axis is the average direction of the heart’s electrical activity during ventricular depolarization. Leads placed on the body sense the sum of the heart’s electrical activity and record it as waveforms.
Cross My Heart
You can determine your patient’s electrical axis by examining the waveforms recorded from the six frontal plane leads: I, II, III, aVR, aVL, and aVF. Imaginary lines drawn from each of the leads intersect the center of the heart and form a diagram known as the hexaxial reference system. (See Hexaxial reference system.)
Where the Axis Falls
An axis that falls between 0 and +90 degrees (some references concede −30 to +90) is considered normal. An axis between +90 and +180 degrees indicates right axis deviation, and one between 0 and −90 degrees indicates left axis deviation. An axis between +180 and −90 degrees indicates extreme axis deviation and is called an indeterminate axis.
To determine your patient’s electrical axis, use one of the two methods described here: the quadrant method or the degree method. (See Axis deviation across the life span)
| Ages and stages |
 Axis deviation across the life span Axis deviation across the life spanRight axis deviation, between +60 degrees and +160 degrees, is normal in a neonate because of dominance of the right ventricle. By age 1, the axis shifts to fall between +10 degrees and +100 degrees as the left ventricle becomes dominant. Left axis deviation commonly occurs in elderly people. This axis shift may result from fibrosis of the anterior fascicle of the left bundle branch or thickness of the left ventricular wall, which increases by 25% between ages 30 and 80. |
Quadrant Method
The quadrant method, a fast, easy way to plot the heart’s axis, involves observing the main deflection of the QRS complex in leads I and aVF. (See Quadrant method.) Lead I indicates whether impulses are moving to the right or left, and lead aVF indicates whether they are moving up or down.
If the QRS-complex deflection is positive or upright in both leads, the electrical axis is normal. If lead I is upright and lead aVF points down, left axis deviation exists.
Right on and Right in
When lead I points downward and lead aVF is upright, right axis deviation exists. Both waves pointing down signal extreme axis deviation.
 Memory jogger Memory joggerThink of the QRS-complex deflections in leads I and aVF as thumbs pointing up or down. Two thumbs up is normal; anything else is abnormal. |
Degree Method
A more precise axis calculation, the degree method gives an exact degree measurement of the electrical axis. (See Degree method.) It also allows you to determine the axis even if the QRS complex isn’t clearly positive or negative in leads I and aVF. To use this method, follow the following steps.
- Review all six leads and identify the one that contains either the smallest QRS complex or the complex with an equal deflection above and below the baseline.
- Use the hexaxial diagram to identify the lead perpendicular to this lead. For example, if lead I has the smallest QRS complex, then the lead perpendicular to the line representing lead I would be lead aVF.
- After you have identified the perpendicular lead, examine its QRS complex. If the electrical activity is moving toward the positive pole of a lead, the QRS complex deflects upward. If it is moving away from the positive pole of a lead, the QRS complex deflects downward.
- Plot this information on the hexaxial diagram to determine the direction of the electrical axis.
Axis Deviation
Finding a patient’s electrical axis can help confirm a diagnosis or narrow the range of possible diagnoses. (See Causes of axis deviation) Factors that influence the location of the axis include the heart’s position in the chest, the heart’s size, the patient’s body size or type, the conduction pathways, and the force of the electrical impulses being generated.
Remember that electrical activity in the heart swings away from areas of damage or necrosis, so the damaged part of the heart will be the last area to be depolarized. For example, in right bundle-branch block (RBBB), the impulse travels quickly down the normal left side and then moves slowly down the right side. This shifts the electrical forces to the right, causing right axis deviation.
No Worries
Axis deviation is not always cause for alarm, and it may not result from a cardiac origin. For example, infants and children normally have right axis deviation. Pregnant women normally have left axis deviation. However, it is important to further investigate the origin with cardiac diagnostic testing, particularly if this is a new finding.
Disorders Affecting a 12-Lead ECG
A 12-lead ECG is used to diagnose such conditions as angina, bundle-branch block, and MI. By reviewing sample ECGs, you will know what classic signs to look for. Here’s a rundown on these three common cardiac conditions and what 12-lead ECG signs to look for.
Angina
During an episode of angina, the myocardium demand s more oxygen than the coronary arteries can deliver. The arteries are unable to deliver enough oxygenated blood to the heart, commonly as a result of atherosclerosis seen in coronary artery disease (CAD), whereby arteries narrow over time because of plaque deposition and calcification. The pathophysiologic process of this condition is further complicated by platelet aggregation, thrombus formation, or vasospasm.
An episode of angina usually lasts a few minutes and may be a precursor to MI.
Stable, Unstable, Variant?
You may hear the term stable, unstable, or variant angina applied to certain conditions. In stable angina, an episode of pain is triggered by exertion or stress and is usually relieved by rest or with medicine. Each episode follows the same pattern and may be associated with chest pain that radiates to the arms, back, or another area.
Unstable angina, which is one of the components of acute coronary syndrome (ACS), is more easily provoked, usually waking the patient. It is also unpredictable, worsens over time, and may last for a longer period of time than stable angina. Chest pain associated with unstable angina may radiate. The patient with unstable angina is treated as a medical emergency as the onset is a common precursor to MI.
Prinzmetal or variant angina usually arises at rest, frequently during the night to early morning. Younger patients experience this type of angina caused by coronary artery spasm triggered by cold weather, stress, smoking, cocaine use, or medicine.
Fleeting Change of Heart
Ischemic changes are evident on the ECG during the episodes of angina and may resolve to some degree when the angina subsides. (See ECG changes associated with angina.) Because these changes may be fleeting, always obtain an order for, and perform, a 12-lead ECG as soon as the patient reports chest pain.
The ECG will allow you to analyze the electrical activity associated with the myocardium, which allows us to determine the culprit coronary artery(ies) involved. By recognizing danger early, you may be able to prevent morbidity or mortality associated with MI.
Pharmacologic agents are a key component of anginal treatment and may include nitrates, beta-adrenergic blockers, calcium channel blockers, and aspirin or glycoprotein IIb/IIIa inhibitors to reduce platelet aggregation, nitrates, beta-adrenergic blockers, calcium channel blockers, and ranolazine. With persistent anginal symptoms, revascularization should be considered to improve symptoms.
Bundle-Branch Block
One potential complication of a MI is a bundle-branch block. In this disorder, either the left or the right bundle branch fails to conduct impulses. A bundle-branch block that occurs farther down the left bundle, in the posterior or anterior fasciculus, is called a hemiblock.
Some blocks require treatment with a temporary pacemaker. In other cases, blocks are monitored to detect whether they progress to a more complete heart block.
Impulsive Behavior
In a bundle-branch block, the impulse travels down the unaffected bundle branch and then from one myocardial cell to the next to depolarize the ventricle.
Because this cell-to-cell conduction progresses much more slowly than the conduction along the specialized cells of the conduction system, ventricular depolarization is prolonged.
Wide World of Complexes
Prolonged ventricular depolarization means that the QRS complex is widened. The normal width of the complex is 0.06 to 0.12 second. If the width increases to greater than 0.12 second, a bundle-branch block is present.
After you identify a bundle-branch block, examine lead V1, which lies to the right of the heart, and lead V6, which lies to the left of the heart. You will use these leads to determine whether the block is in the right or left bundle.
Right Bundle-Branch Block
RBBB occurs with such conditions as anterior wall MI, CAD, cardiomyopathy, cor pulmonale, and pulmonary embolism. It may also occur without cardiac disease. If this block develops as the heart rate increases, it is called rate-related RBBB. (See How RBBB occurs)
In this disorder, the QRS complex is greater than 0.12 second and has a different configuration, sometimes resembling rabbit ears or the letter “M.” (See Recognizing RBBB) Septal depolarization is not affected in lead V1, so the initial small R wave remains.
The R wave is followed by an S wave, which represents left ventricular depolarization, and a tall R wave (called R prime, or R’), which represents late right ventricular depolarization. The T wave is negative in this lead. However, that deflection is called a secondary T-wave change and is of no clinical significance.
Opposing Moves
The opposite occurs in lead V6. A small Q wave is followed by depolarization of the left ventricle, which produces a tall R wave. Depolarization of the right ventricle then causes a broad S wave. In lead V6, the T wave should be positive.
Left Bundle-Branch Block
Left bundle-branch block (LBBB develops from underlying pathology often caused by hypertensive heart disease, aortic stenosis, degenerative changes of the conduction system, or CAD. (See How LBBB occurs) When it occurs in conjunction with an anterior wall MI, it usually signals complete heart block requiring insertion of a pacemaker.

One Ventricle after Another
In LBBB, the QRS complex will be greater than 0.12 second because the ventricles are activated sequentially, not simultaneously. (See Recognizing LBBB) As the wave of depolarization spreads from the right ventricle to the left, a wide S wave is produced in lead V1, with a positive T wave. The S wave may be preceded by a Q wave or a small R wave.
Slurring Your R Waves
In lead V6, no initial Q wave occurs. A tall, notched R wave, or a slurred one, is produced as the impulse spreads from right to left. This initial positive deflection is a sign of LBBB. The T wave is negative.
Myocardial Infarction
Unlike stable angina, pain associated with a MI lasts from several minutes up to several hours and is unrelieved by rest. Frequently, anginal pain escalates in frequency and duration as of acute coronary syndrome prodrome. The location of the MI varies depending upon the culprit coronary artery.
For as long as the myocardium is deprived of an oxygen-rich blood supply, an ECG will reflect the three pathologic changes of a MI: ischemia, injury, and infarction. (See Reciprocal changes in a MI)
The area of myocardial necrosis is called the zone of infarction. Scar tissue eventually replaces the dead tissue, and the damage caused is irreversible.
The ECG change associated with a necrotic area is a pathologic Q wave, which results from lack of depolarization. Such Q waves are permanent. MIs that do not produce Q waves are called non–Q-wave MIs. (See Q waves in children.)
The zone of infarction is surrounded by the zone of injury, which appears on an ECG as an elevated ST segment. ST-segment elevation results from a prolonged lack of oxygenated blood supplied to the myocardium.
The outermost area is called the zone of ischemia and results from an interrupted supply of oxygenated blood. This zone is represented on an ECG by T-wave inversion. Changes in the zones of ischemia or injury are reversible.
From Ischemia to Injury
Generally, as a MI occurs, the patient experiences chest pain and an ECG shows changes, such as ST-segment elevation, which indicates that myocardial injury is in process. Accompanying changes include flattened or inverted T waves.
Rapid treatment can prevent myocardial necrosis. However, if symptoms persist for more than 6 hours, little can be done to prevent necrosis. That is one of the reasons patients are advised to seek medical attention as soon as symptoms begin.
The Telltale Q Wave
Q waves can appear hours to days after a MI and signify that an entire thickness of the myocardium has become necrotic. Tall R waves in reciprocal leads may also develop. This type of MI is called a transmural, or Q-wave, MI.
Back to Baseline
Knowing how long such changes last can help you determine how long ago a MI occurred. ST segments return to baseline within a few days to 2 weeks. Inverted T waves may persist for several months. Although not every patient who has had a MI develops Q waves, those who do may have them on their ECGs indefinitely.
What to Do for a MI?
The most important step you can take for a patient with a MI is to remain vigilant about detecting changes in his condition and ECG. (See Monitoring MI patients.)
| Mixed signals |
 Monitoring MI patients Monitoring MI patientsRemember that specific leads monitor specific walls of the heart. Here’s a quick overview of those leads:
|
The primary goal of treatment for a MI is to limit the size of the infarction by increasing oxygen supply to the myocardium and decreasing workload. (See Improving blood flow.)
In addition to rest, pain relief, and supplemental oxygen, such medications as nitroglycerin, morphine sulfate, beta-adrenergic blockers, calcium channel blockers, angiotensin-converting enzyme inhibitors, and antiarrhythmics are used. Aspirin or glycoprotein IIb/IIIa inhibitors may be used to reduce platelet aggregation. Thrombolytic therapy may also be prescribed to dissolve a thrombus occluding a coronary artery.
Identifying Types of MI
The location of the MI is a critical factor in determining the most appropriate treatment and predicting probable complications. Characteristic ECG changes that occur with each type of MI are localized to the leads overlying the infarction site. (See Locating myocardial damage.) Here’s a look at characteristic ECG changes that occur with different types of MI.
Anterior Wall MI
The left anterior descending artery supplies blood to the anterior portion of the left ventricle. The artery supplies blood to the ventricular septum and portions of the right and left bundle-branch systems.
When the anterior descending artery becomes occluded, an anterior wall MI occurs. (See Recognizing an anterior wall MI.)
Complications of an anterior wall MI include varying second-degree atrioventricular blocks, bundle-branch blocks, ventricular irritability, and left-sided heart failure.
Changing the Leads
An anterior wall MI causes characteristic ECG changes in leads V3 to V4. The precordial leads show poor R-wave progression because the left ventricle can’t depolarize normally. ST-segment elevation and T-wave inversion are also present.
The reciprocal leads for the anterior wall are the inferior leads II, III, and aVF. They show tall R waves and depressed ST segments.
Septal Wall MI
The patient with a septal wall MI has an increased risk for developing a ventricular septal defect. ECG changes are present in leads V1 and V2. In those leads, the R wave disappears, the ST segment rises, and the T wave inverts.
Because the LAD artery also supplies blood to the ventricular septum, a septal wall MI commonly accompanies an anterior wall MI. (See Recognizing an anteroseptal wall MI.)
Lateral Wall MI
A lateral wall MI is usually caused by a blockage in the left circumflex artery and shows characteristic changes in the left lateral leads I, aVL, V5, and V6. The reciprocal leads for a lateral wall infarction are leads II, III, and aVF. (See Recognizing a lateral wall MI)
This type of infarction typically causes premature ventricular contractions and varying degrees of heart block. A lateral wall MI usually accompanies an anterior or inferior wall MI.
Inferior Wall MI
An inferior wall MI is usually caused by occlusion of the right coronary artery and produces characteristic ECG changes in the inferior leads II, III, and aVF and reciprocal changes in the lateral leads I and aVL. (See Recognizing an inferior wall MI) It’s also called a diaphragmatic MI because the heart’s inferior wall lies over the diaphragm.
Patients with inferior wall MI are at risk for developing sinus bradycardia, sinus arrest, heart block, and premature ventricular contractions. This type of MI occurs alone, with a lateral wall MI, or with a right ventricular MI.
Right Ventricular MI
A right ventricular MI usually follows occlusion of the right coronary artery. This type of MI rarely occurs alone. In fact, 40% of all patients with an inferior wall MI also suffer a right ventricular MI.
A right ventricular MI can lead to right-sided heart failure or right-sided block. The classic changes are ST-segment elevation, pathologic Q waves, and inverted T waves in the right precordial leads V4R to V6R. (See Recognizing a right ventricular MI.)
Take the Right Lead
Identifying a right ventricular MI is difficult without information from the right precordial leads. If these leads aren’t available, you can observe leads II, III, and aVF or watch leads V1, V2, and V3 for ST-segment elevation. If a right ventricular MI has occurred, use lead II to monitor for further damage.
Posterior Wall MI
A posterior wall MI is caused by occlusion of either the right coronary artery or the left circumflex arteries. This MI produces reciprocal changes on leads V1 and V2.
Classic ECG changes in a posterior wall MI include tall R waves, ST-segment depression, and upright T waves. (See Recognizing a posterior wall MI) Posterior infarctions usually accompany inferior infarctions. Information about the posterior wall and pathologic Q waves that might occur can be obtained from leads V7 to V9 using a posterior ECG.